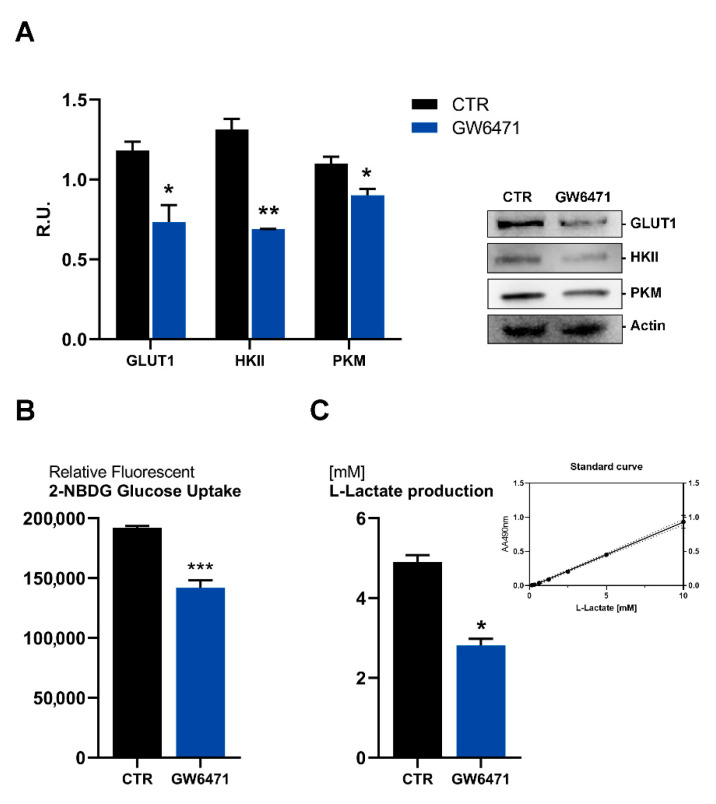
Figure 4.
(A) Western blotting analyses for GLUT1, HKII, PKM in control and treated mammospheres. A representative western blot image is shown. ** p < 0.005; * p < 0.05 vs. CTR (n = 3). (B) Glucose uptake analyses with the fluorescent tracer 2-NBDG. *** p < 0.0005 vs. CTR (n = 3). (C) L-lactate production in control and treated mammospheres analyzed by Glycolysis Cell-Based Assay Kit. * p < 0.05 vs. CTR (n = 3). The standard curve obtained in the assay is shown.

