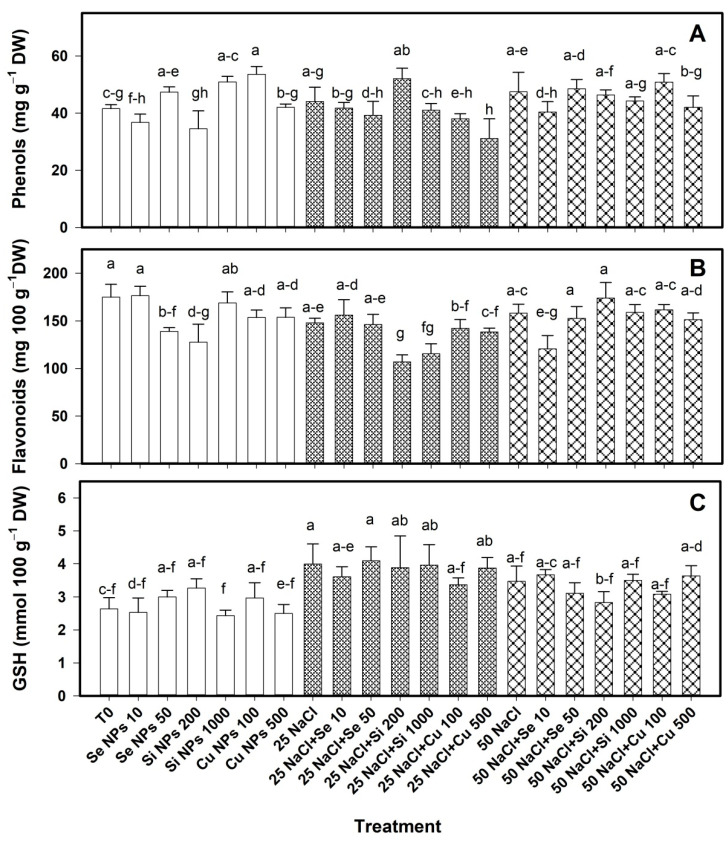
Figure 4.
Content of phenols (A), flavonoids (B) and glutathione (C) in leaves of bell pepper plants under saline stress. T0: control; 25 NaCl: 25 mM NaCl; 50 mM NaCl: 50 mM NaCl; NPs: nanoparticles; Numbers represent de quantities of NaCl (mM) or NPs (mg L−1) applied. Different letters indicate significant differences between treatments according to Least Significant Difference Fisher´s Test (α = 0.05). n = 5 ± standard error.

