Figure 3.
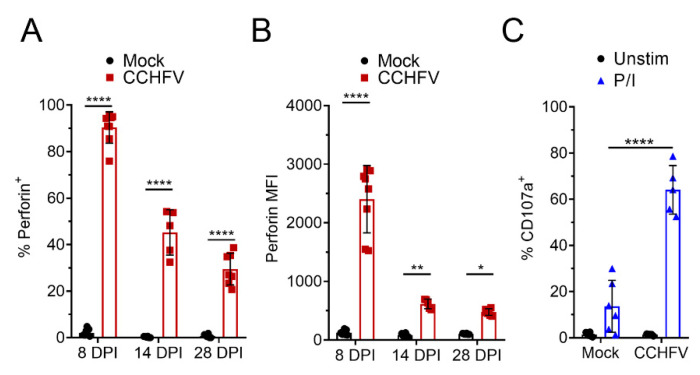
CD8+ T-cells from CCHFV-infected mice express perforin and degranulate. IFNAR−/− mice were infected with CCHFV or mock-infected. At indicated time points, mice were euthanized, single cell suspensions generated from the liver, and analyzed by flow cytometry. (A–C) Liver CD8+ T-cells were identified as CD3+CD4−CD8+ and (A,B) intracellular perforin expression in CD8+ T-cells measured after 4 h ex vivo incubation in the presence of brfA. (A) Percent CD8+ T-cells positive for perforin expression and (B) the median fluorescent intensity (MFI) of all CD8+ T-cells is shown. (A,B) N = 5–8 per group. Error bars indicate standard deviation. Statistical comparison between CD8+ T-cells from CCHFV-infected mice (red) and mock-infected mice (open bar) was performed with a two-way ANOVA with Sidak’s multiple comparison test. (C) Degranulation of liver CD8+ T-cells at day 14 PI was monitored by CD107a staining. Percent CD107a+ CD8+ T-cells after indicated stimulation in the presence of brfA, monensin, and PE-conjugated CD107a is shown. Unstim = no stimulation. P/I = PMA and ionomycin. Error bars indicate standard deviation. N = 5 to 6 per group. Statistical comparison between CD8+ T-cells from CCHFV-infected mice and mock-infected mice was performed with a two-way ANOVA with Sidak’s multiple comparison test. * p < 0.05, ** p < 0.01, **** p < 0.0001.

