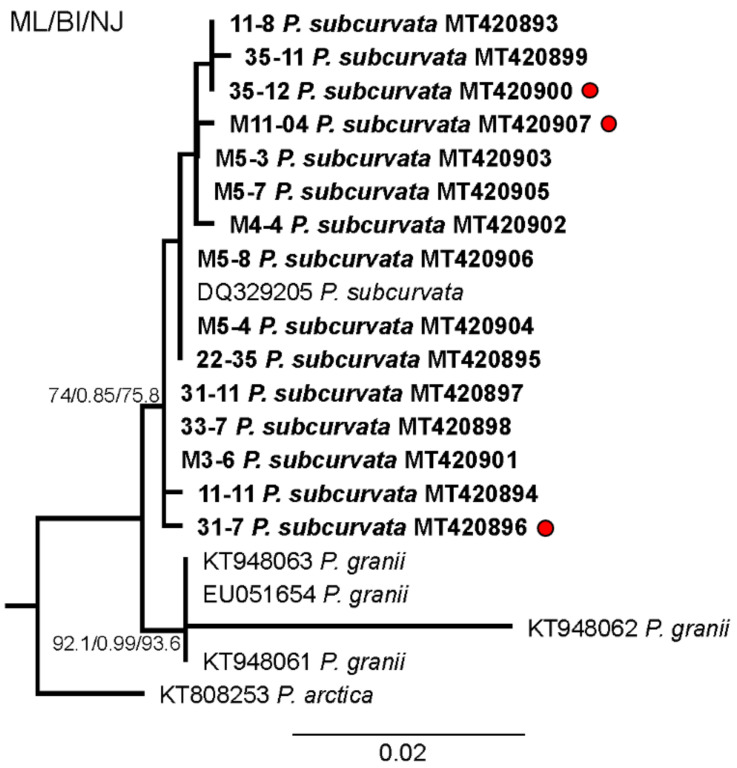
Figure 1.
Phylogenetic analysis based on maximum likelihood (ML) of the strains of P. subcurvata included in this study. Numbers at nodes represent the bootstrap values of an ML analysis with 1000 replicates/posterior probability of Bayesian inference (BI) analysis/bootstrap values of neighbour-joining (NJ) out of 10,000 replicates. The scale bar corresponds to two substitutions per 100 nucleotide positions.

