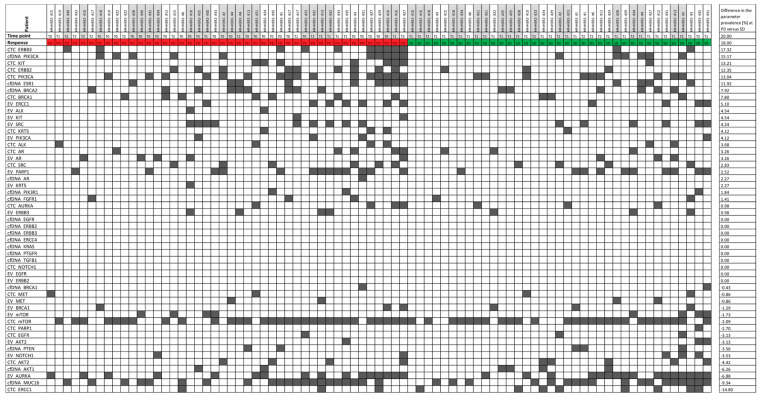
Figure 3.
Heatmap of the signal prevalence in samples drawn at a progressive disease time point (PD, red) versus stable disease time point (SD, green). The 81 samples were divided into the population of samples drawn at PD (44 samples) and SD (37 samples). The signal prevalence (in %) of all 51 parameters was calculated in the two populations separately and was then compared by calculating the difference in the prevalence within the two populations.

