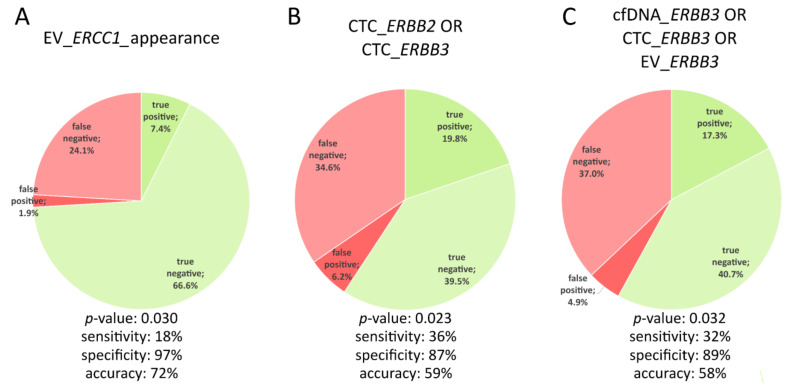
Figure 4.
Characteristics of the three monitoring markers identified. A significant correlation (p-value < 0.05) between the signal appearance (A) or parameter combination (B + C) and disease progression was shown using the two-tailed Fisher’s exact test. The accuracy of the three monitoring markers decreases from left to right.

