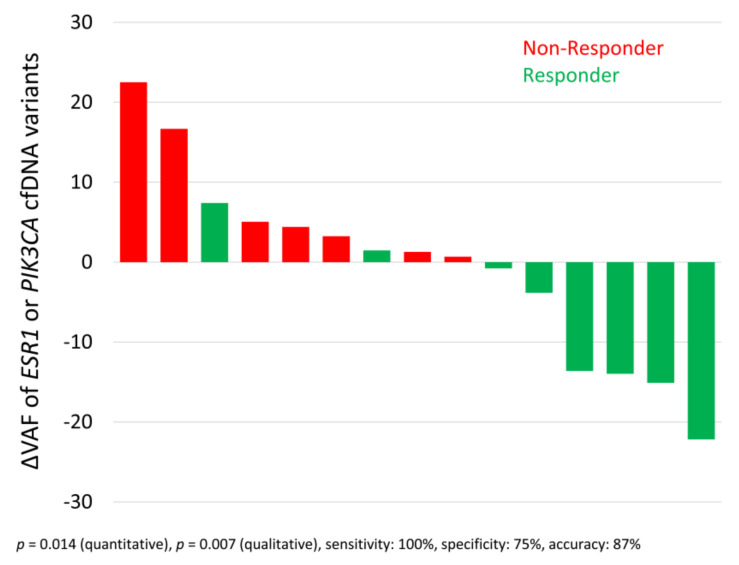
Figure 5.
Waterfall plot mapping the cfDNA variant allele frequency (VAF) development of ESR1 or PIK3CA variants and therapy response. Difference in variant allele frequencies (ΔVAF) of ESR1 variants or PIK3CA variants between two consecutive staging time points correlated with therapy response (at the second time point evaluated by radiologic imaging and according to RECIST). Only the 15 cases with a detectable VAF at one time point and the next time point were evaluated. The two-tailed Mann–Whitney U-test and the two-tailed Fisher’s exact test were used to evaluate the ∆VAFs thus obtained.

