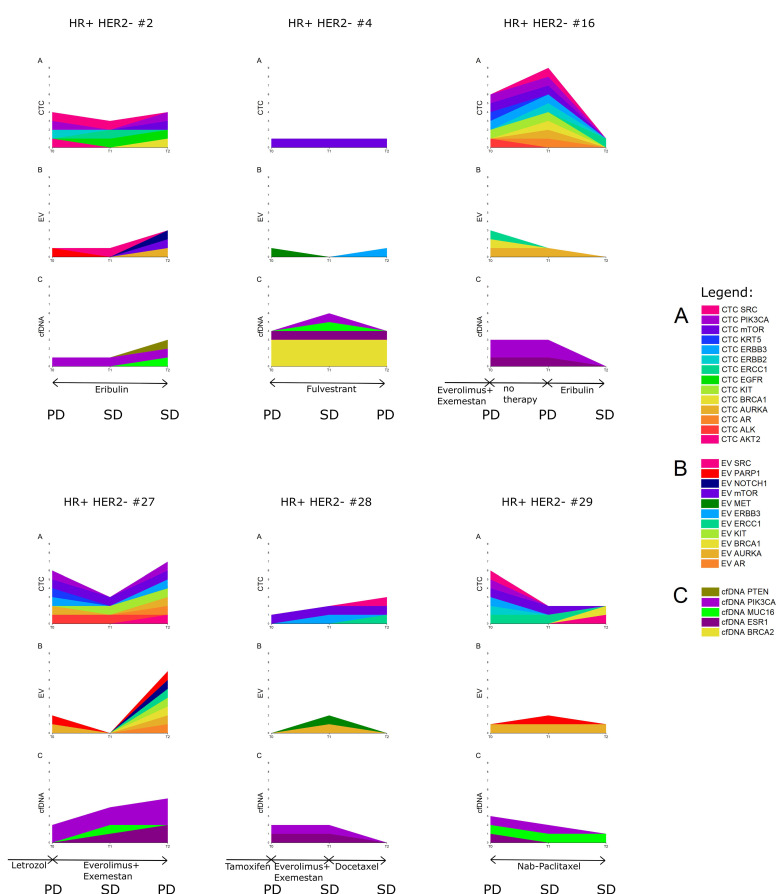
Figure 6.
Development of CTC and EV overexpression signals and cfDNA variants in six index patients at three consecutive staging time points. The staging result (by radiologic imaging according to RECIST guidelines) at the time point at which blood was drawn is indicated as PD (progressive disease) or SD (stable disease). (A) CTC mRNA signals, (B) EV mRNA signals, and (C) cfDNA variants. Within each analyte, each color indicates a variant in another gene or overexpression signal of another transcript, while data of the same gene or transcript in different analytes are indicated with the same color.

