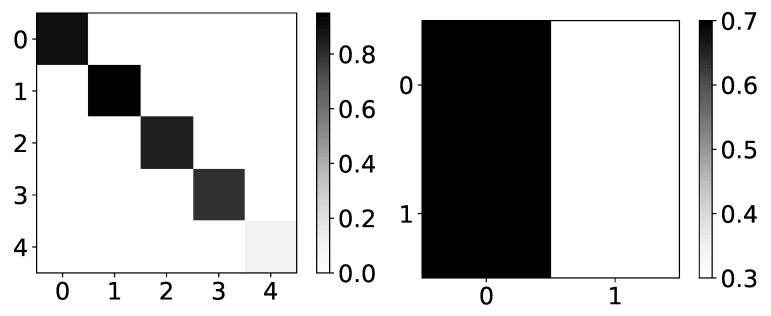
Figure 7.
Percentage of TCDF retrieved causality association within series in dataset 2 and 4. On the y-axis, we plot the target time series. The x-axis corresponds to the index of the series whose impact on the selected target series we count. Values in a single row do not need to sum to 1 for TCDF because there can be a case where TCDF did not find any causality for the targeted time series. These are not attention coefficients. In the left panel, we plot the percentage of experiments that TCDF did find causality for dataset 2. We can see that interpretability is correct for this dataset. However, for the last time series, it found causality in a small percentage of experiments. It is crucial to notice that TCDF never found incorrect causality in this dataset. In the right panel, we plot the percentage of experiments that TCDF did find causality for dataset 4. For this dataset, TCDF always says that a single time series is generating both of them. In the majority of experiments, it was time series with index 0.

