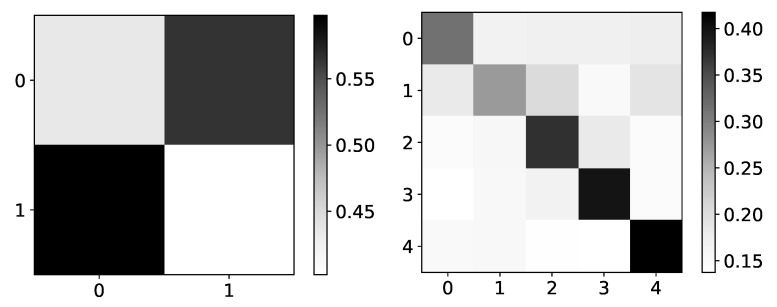
Figure 9.
The mean values of coefficients from IMV-LSTM model for dataset 4 and dataset 2. The y-axis corresponds to the target series index, and the x-axis corresponds to the index of series whose impact on selected target series we plot. left) In the left panel, we plot mean coefficients of IMV-LSTM model for dataset 4. We can see that IMV-LSTM model gives correct interpretability for this dataset, but with low confidence. In the right panel, we plot mean coefficients of IMV-LSTM for dataset 2. Again, IMV-LSTM model gives correct interpretability, but with high confidence on this dataset.

