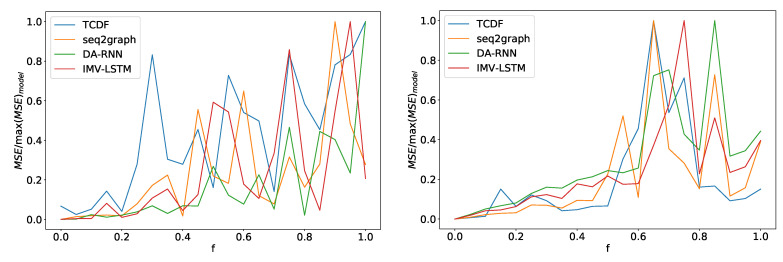
Figure 14.
In the left panel, we can see how the maximum error percentage for specific model changes with f for dataset 2. We observe a change in behavior at around . In the right panel, we can see results for dataset 7. Here we see a change in behavior around . All models show similar behavior with a slight deviation from the TCDF model on dataset 2.

