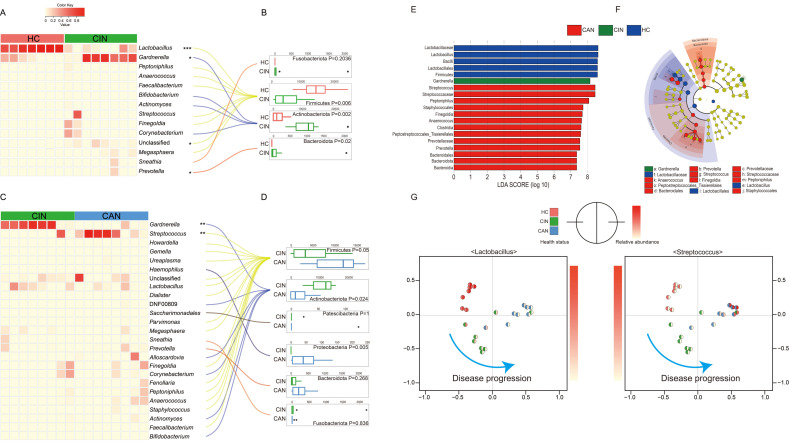
Figure 2.
Comparative analysis of vaginal microbiota profiles. Differences in microbial composition between each group at the genus (A,C) and corresponding phylum levels (B,D) are presented as a heat map. The LDA effect size (LEfSe) analysis to identify the potential biomarkers revealed changes of the vaginal microbiota according to health status (E,F). (G) The Bray–Curtis dissimilarity based PCoA plot is colored by the relative abundance of the Lactobacillus and Streptococcus genera; the left hemisphere indicates the health status and the right presents the relative abundance of each bacterial genus. Statistical significance was computed using the Wilcoxon rank–sum test; * p < 0.05, ** p < 0.01, *** p < 0.001.

