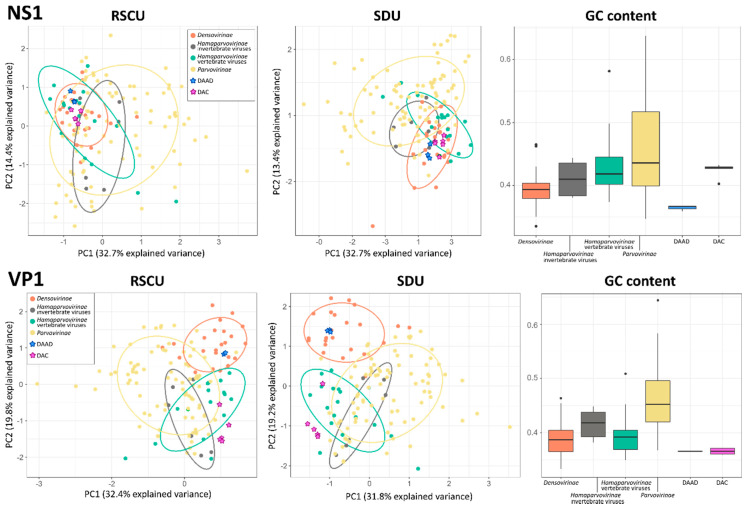
Figure 5.
Compositional analyses of viruses within the Parvoviridae. Principal component analysis (PCA) plots based on relative synonymous codon usage (RSCU) and synonymous dinucleotide usage (SDU) values are shown on the left and in the center, respectively; ellipses are drawn around groups as indicated in the legend with a normal probability size of 70% and axes represent dimensions explaining the largest variances. Box-and-whisker plots based on GC contents in each group are showed on the right; upper and lower whiskers indicate the highest and lowest values within 1.5 times the interquartile range, while boxes indicate the interquartile range itself with average values displayed as thick lines. Dots indicate potential outliers.

