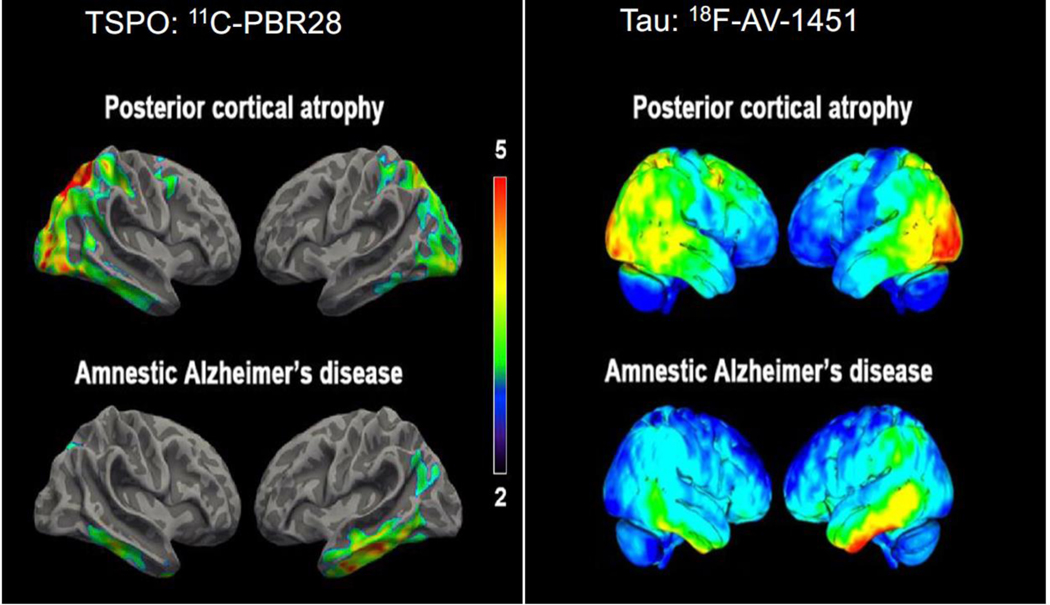
Figure 2. TSPO and tau imaging: Alzheimer’s Disease (AD) versus Posterior Cortical Atrophy (PCA).
Topographical distribution of translocator protein (TSPO) resembles that of tau pathology in different clinical subtypes of Alzheimer’s disease (AD). Left panel: Surface-based projection maps showing differences in [11C]PBR28 binding (measured as standardized uptake value ratio (SUVR), cerebellar reference) between individuals with AD and age-matched controls for posterior cortical atrophy (PCA, a visual variant of AD, top) and typical amnestic presentation of AD (bottom). Contrast threshold is P < 0.05 after family-wise correction for multiple comparisons and TSPO genotype, age, and education as covariates. Color bars denote T-values. Right panel: Single-subject PET SUVR images from a separate study in which [18F]AV-1451 was used to label neurofibrillary tau deposits. Representative participants with PCA (top) or amnestic AD (bottom) are shown. [11C]PBR28 images adapted from59 and [18F]AV-1451 images adapted from.60 The [18F]AV-1451 images are printed and adapted by permission of Oxford University Press on behalf of the Guarantors of Brain. OUP and the Guarantors of Brain are not responsible or in any way liable for the accuracy of the adaptation.

