
Figure 1. Junction-balanced genome graphs enable complex structural variant characterization.
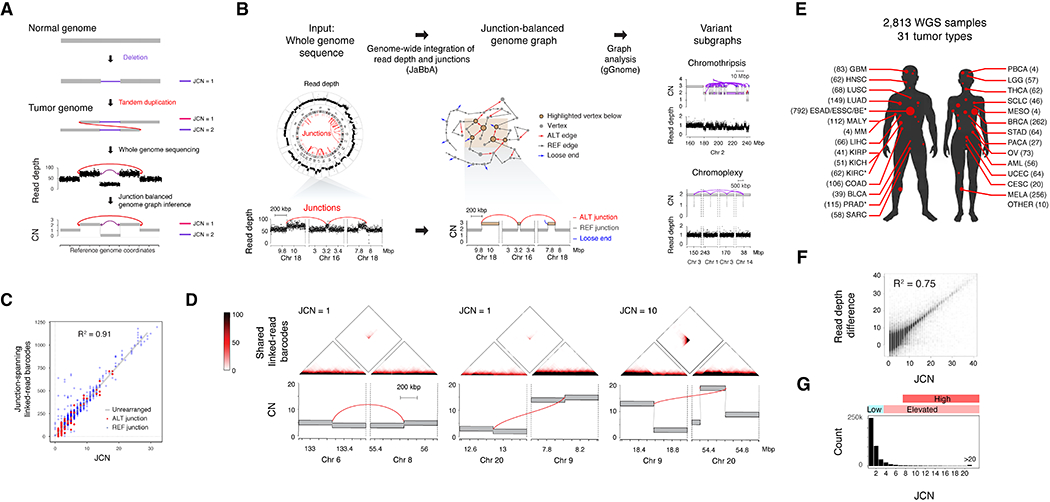
(A) Schematic of elevated junction copy number (JCN) from the duplication of an allele harboring a DEL-like junction, resulting in a characteristic read depth and junction pattern from which a junction-balanced genome graph can be reconstructed. (B) Junction balance analysis (JaBbA) integrates binned WGS read depth data and junctions to estimate JCN and generates coherent models of rearranged genome structure. The topology of JCN can be used to define complex SV events as variant subgraphs. (C) The coverage of junction-spanning 10X linked-read barcodes in HCC1954 (y axis) correlates highly with the JaBbA JCN estimate, obtained through the analysis of HCC1954 short-read WGS (x axis). (D) Top, heatmap of the number of 10X linked-read barcodes shared between each pair of 1 kbp genomic bins. Bottom, JaBbA genome graphs within 400 kbp of the featured junctions. (E) Tumor type sample counts across 2,778 genome graphs. See Table S1 for abbreviations. * marks datasets with multiple samples. (F) Correlation of the purity and ploidy corrected read depth difference vs. JaBbA-fitted JCN. (G) Histogram of JCNs and their associated categories in the cohort. See also Fig. S1 and Tables S1–S3