
Figure 2. Rigma and pyrgo are novel patterns of clustered low copy rearrangements.
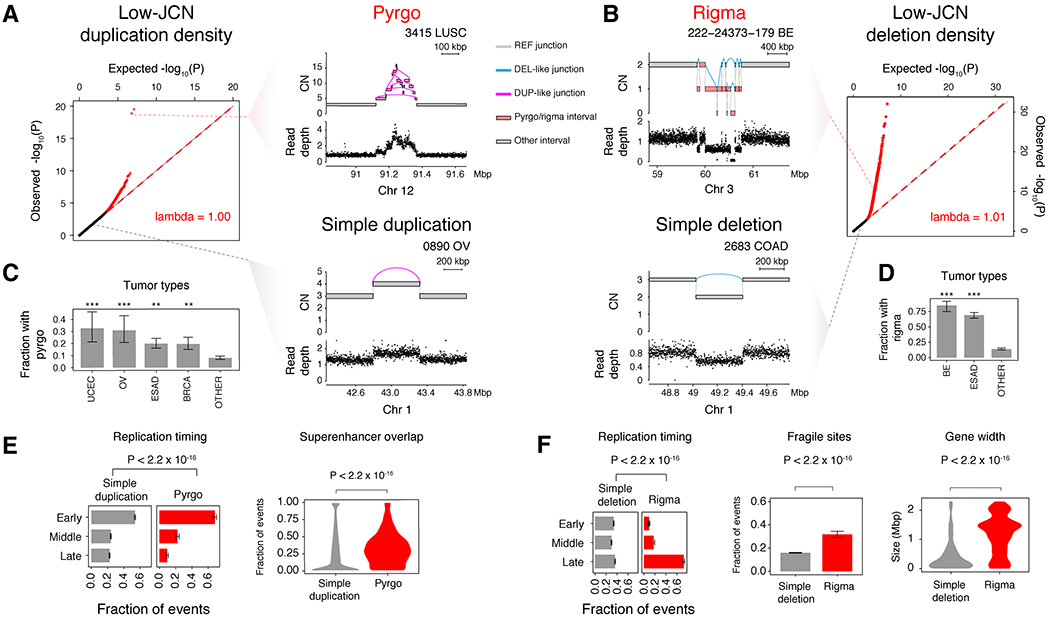
(A) Quantile-quantile (Q-Q) plot of observed vs. expected −log10(P) quantiles obtained from a gamma-Poisson model of low-JCN DUP-like junction density across genomic bins (see STAR Methods). Red dots indicate sample-specific model outliers (FDR<0.5). Top right, an example of a pyrgo-associated outlier window with a high density of low-JCN DUP-like rearrangements within a sample. Bottom right, a non-outlier window containing a simple duplication event. (B) Right, Q-Q plot similar to (A), but low-JCN DEL-like junctions. Top left, an example of a rigma-associated outlier window containing a high density of low-JCN DEL-like junctions within a sample. Bottom left, a non-outlier window containing a simple deletion event. (C-D) Fraction of samples within tumor types that harbor pyrgo and rigma, respectively. Significantly enriched tumor types (compared to all others) are marked by asterisks (Fisher’s exact test). Significance levels: *** (P < 1 × 10⁻³), ** (P < 0.01), * (P < 0.05). (E-F) Association of events with replication timing (ordinal logistic regression), superenhancers (Hnisz et al., 2013) (logistic regression), known fragile sites (Kumar et al., 2019) (logistic regression), and gene width (Wilcoxon rank-sum test, Bonferroni corrected P-values < 0.05). Error bars on bar plots represent 95% confidence intervals on the Bernoulli trial parameter. See also Fig. S2