
Figure 3. Rigma junctions evolve gradually and in trans.
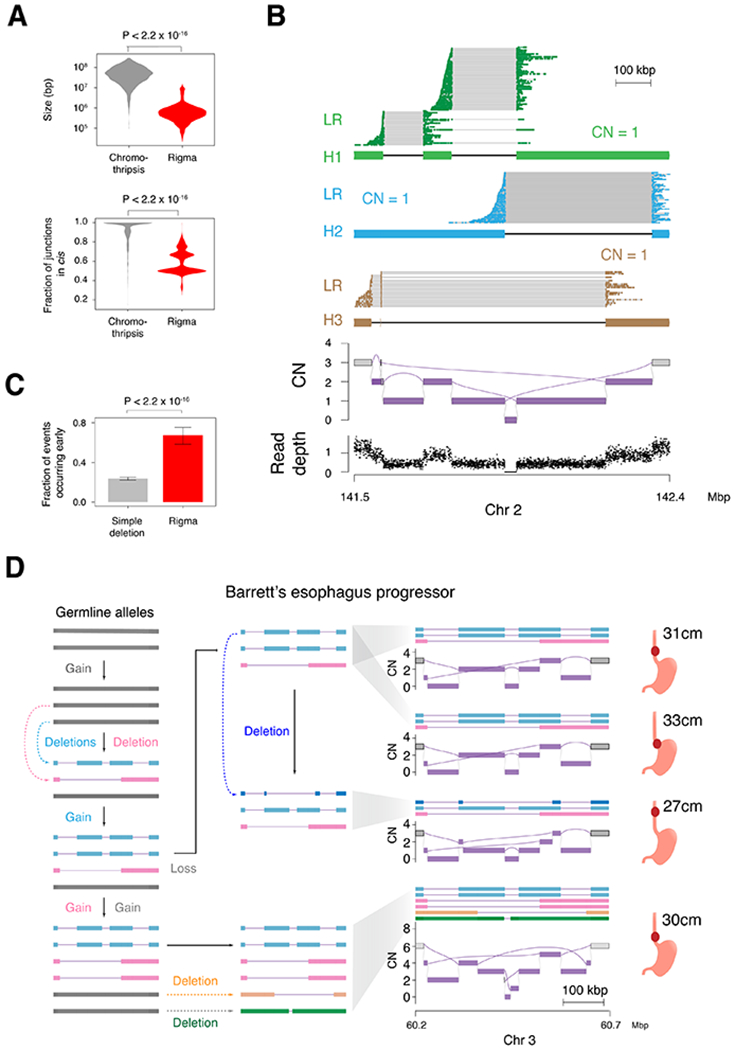
(A) Top, comparison of the total genomic territory covered by chromothripsis and rigma footprints. Bottom, the fraction of rearrangements that occur in cis (i.e. on the same predicted haplotype) when the longest possible contigs are inferred from the JaBbA graph. (B) Linked-read (LR) sequencing and local allelic deconvolution of a rigma found in a lung adenocarcinoma cell line (NCI-H838, see STAR Methods) demonstrates DEL-like junctions occur on separate haplotypes (i.e. in trans). (C) A comparison of the fraction of events that occur early (i.e. in multiple samples from the same patient) for simple deletions and rigma in the BE cohort, which has a median of 4 samples per patient across 80 patients. (D) Reconstruction of haplotypes across multiple samples from a single case in the BE WGS dataset. P-values obtained by Wilcoxon rank-sum test in (A) and Fisher’s exact test in (C). RD, read depth. Error bars on bar plots represent 95% confidence intervals on the Bernoulli trial parameter. See also Fig. S3