
Figure 5. Tyfonas are enriched in breakend hypermutation outside of SBS 2/13.
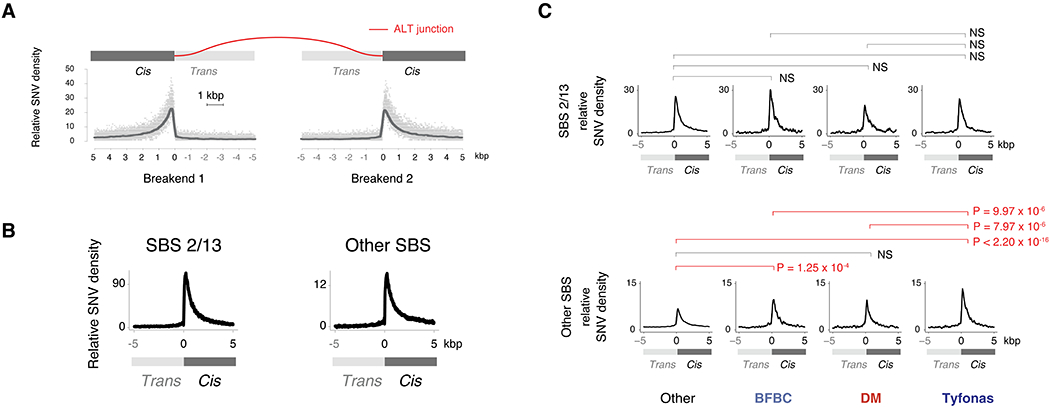
(A) Breakend-centered coordinate system to analyze mutational patterns near junctions. Top, the cis (+ coordinates) sides of the breakend (i.e. attached to the junction) have been fused across the rearrangement junction (red-colored line), while the trans (− coordinates) sides are disconnected from this derivative allele. Bottom, relative SNV density is the CN corrected and 101 bp smoothed density of SNVs at every base pair on this axis normalized to the average SNV density between −5 and 0 kbp. (B) Relative SNV density of SBS 2/13 and all other SBS associated contexts near breakends demonstrates a peak in the first 1 kbp on the cis side of the breakend. (C) Normalized breakend density for SBS 2/13 (top) and other SBS (bottom) SNVs for each of amplified event types. Enrichment P-values obtained from Wald test by gamma-Poisson regression (see STAR Methods). Significance determined by Bonferroni correction at a threshold of < 0.05. See also Fig. S5