
Figure 6. Chromosomal integration of a MYB / MYCN -associated tyfonas in a small cell lung cancer cell line.
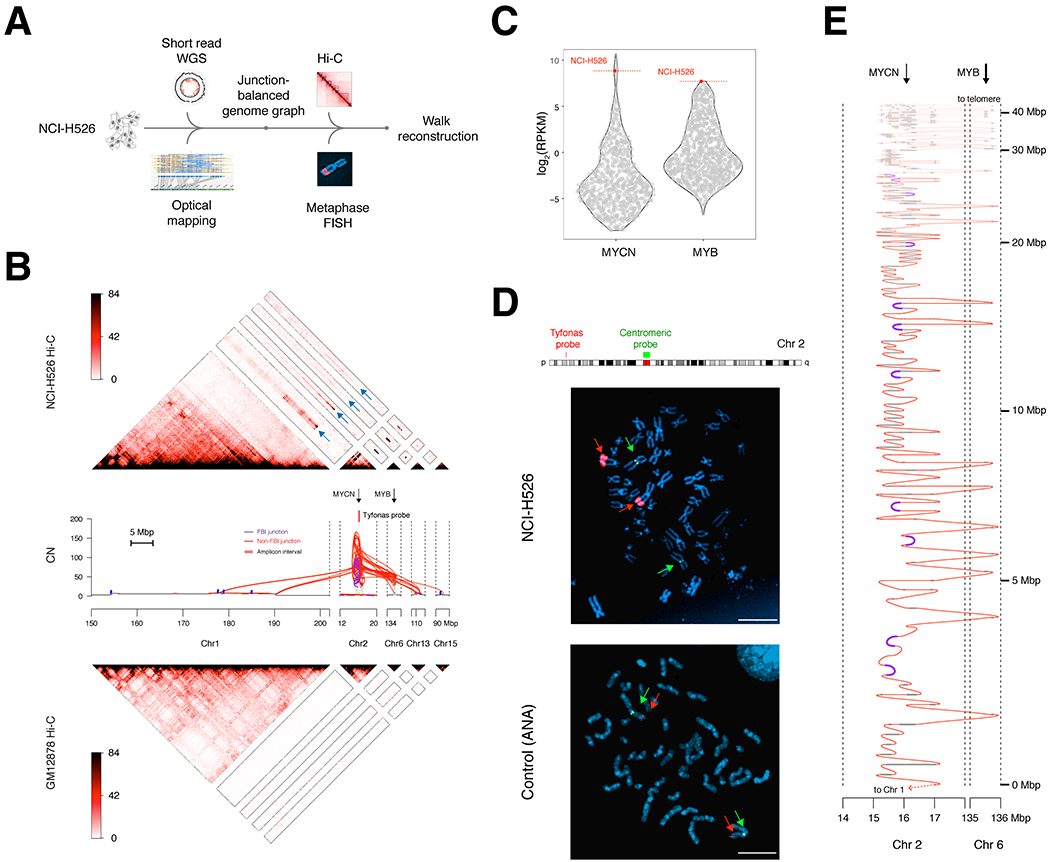
(A) Multi-platform profiling of a tyfonas in the small cell lung cancer cell line NCI-H526. (B) Top, heatmap of Hi-C in cell line NCI-H526 demonstrating MYCN and MYB co-amplification and contiguity with chromosome 1. Blue arrows on the Hi-C heatmap highlight the pixels supporting contiguity of tyfonas fragments with chromosome 1. Middle, JaBbA graph of the NCI-H526 tyfonas, where junction input was derived from short-read WGS and Bionano genomics optical mapping. The locations of MYCN, MYB, and the tyfonas BAC probes used for FISH experiments are shown. Bottom, Hi-C profiling of the normal cell line GM12878, obtained from (Rao et al., 2014). (C) Relative expression of MYCN and MYB across the Cancer Cell Line Encyclopedia (Ghandi et al., 2019b). (D) Metaphase FISH of NCI-H526 using a chromosome 2 probe targeting the center of the tyfonas near MYCN (red) and a second probe targeting the chromosome 2 centromere (green) (scale bars, 5 μm). (E) Candidate reconstruction of a linear allele spanning the tyfonas amplicon. The coordinates of the reconstructed allele (y axis) are shown using a nonlinear axis which begins at a junction adjacent to chromosome 1, and repeatedly threads between the MYCN and MYB genes, which are both amplified by the event. See also Fig. S6