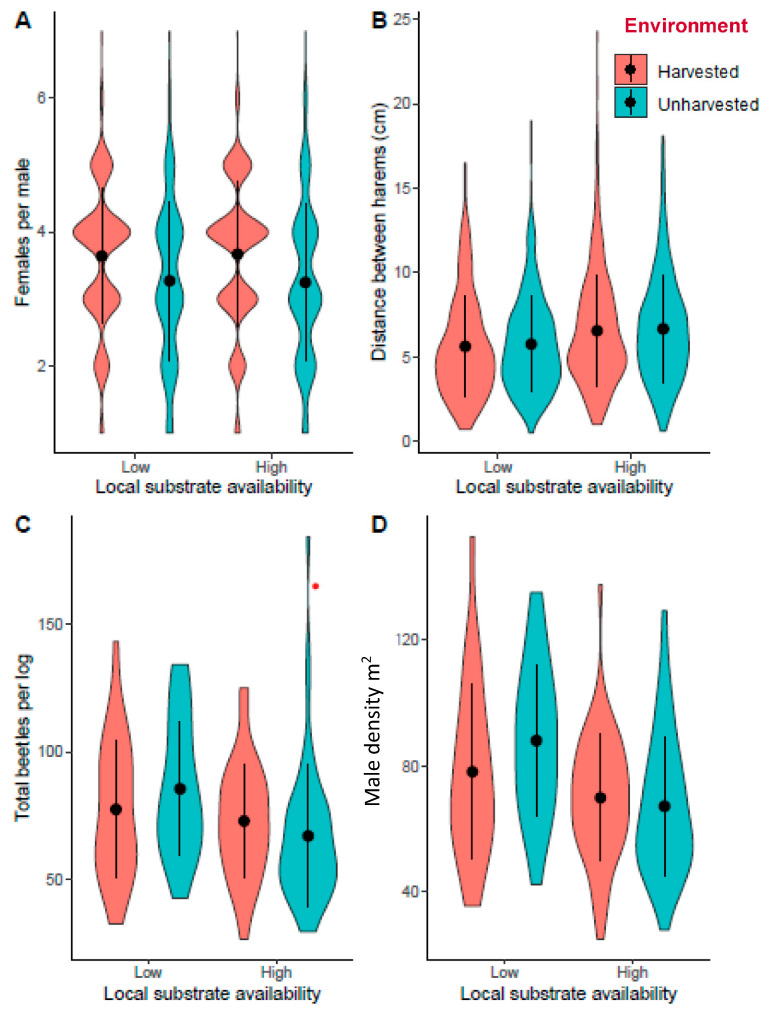
Figure 3.
Violin plots indicating the spread and (A) mean (±SD) number of females per male (harem size), (B) mean (±SD) distance to the nearest harem (male nuptial chamber), (C) mean total number of beetles (males and females) per log (±SD), and (D) mean density (±SD) of males on a log (number of males per m2) in relation to local substrate availability (high = 10 logs/pile, low = 5 logs/pile) in harvested and unharvested pine plantations.

