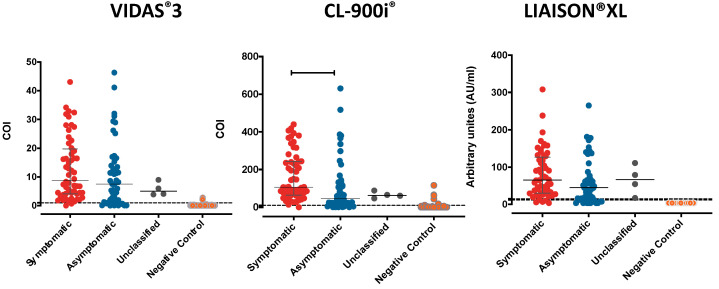
Figure 2.
Distribution of numerical results obtained from each automated analyzer. Results are represented as dot plots to review the scatter of values around the prespecified assay cut-off (shown as dashed lines). Data are presented for 111 RT-PCR confirmed SARS-CoV-2 samples (symptomatic, asymptomatic, and unclassified), and 127 pre-pandemic control samples for each of the three automated assays. The dashed lines represent the cut-off values for the automated assays. The continuous lines represent the median and confidence interval (CI) for each group. One-way analysis of variance (ANOVA) was used to compare the differences between groups.

