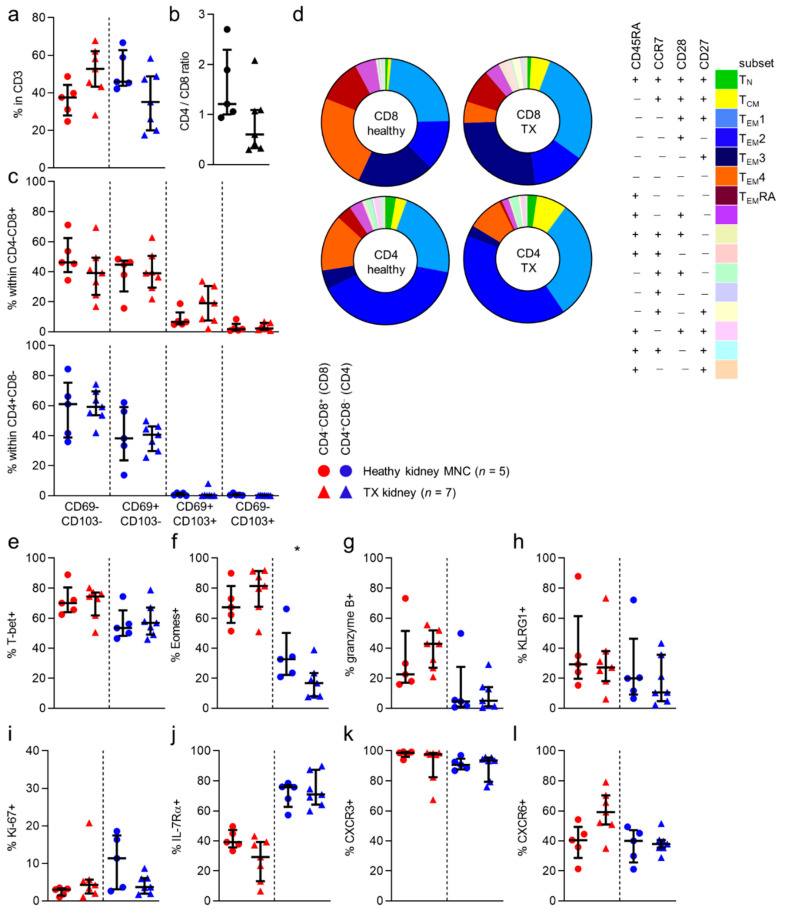
Figure 3.
No differences in phenotype between healthy kidney and allograft T cells.(a) Percentage of CD4−CD8+ (CD8) and CD4+CD8− (CD4) T cells within CD3+CD45+ single-cell live lymphocytes from healthy kidney compared to transplanted (TX) kidney (median with IQR in black). (b) CD4/CD8 ratio within PB and healthy kidney-derived T cells. (c) Distribution of CD69/CD103 based subsets within CD8 and CD4 T cells (median with IQR in black) derived from healthy and TX kidney (median with IQR in black). (d) Expression patterns of CD27, CD45RA, CCR7 and CD28 within CD8 and CD4 T cells from healthy kidney and TX (transplanted) kidney (median). (e–l) Comparison of expression of T-bet (e), Eomes (f), granzyme B (g), KLRG1 (h), ki-67 (i), IL-7Rα (j), CXCR3 (k) and CXCR6 (l) in CD8 (red) and CD4 (blue) T cells derived from healthy kidney and TX kidney (median with IQR in black). Mann-Whitney U-test was used for statistical comparison. Only significant p-values are displayed: * p < 0.05.

