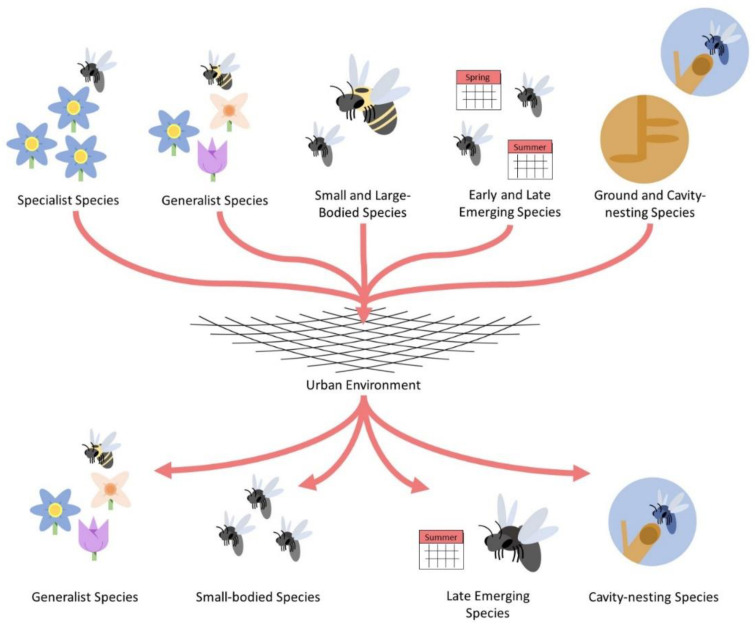
Figure 2.
Simplistic diagram depicting the filtering of some functional traits comprising urban bee communities. The “net” in the center of the diagram represents a generic urban environment with all its associated local and landscape features that may influence bee community structure. General bee functional traits are presented at the top of the figure whereas traits selectively favored by cities are presented at the bottom.

