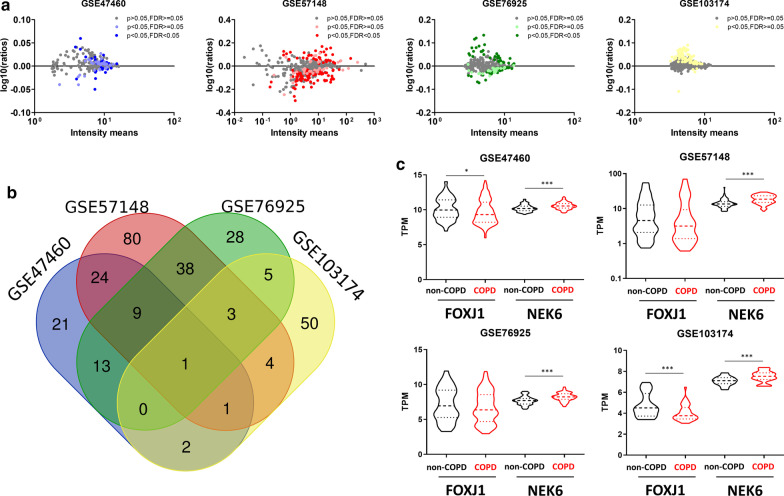
Fig. 2.
Identification of cilia-associated deregulated genes in COPD whole lung tissues. a dot plots showing cilia-associated genes signature quantification and significant fold change in COPD lung tissues compared with non-COPD lung tissues per dataset. b Venn diagram of overlapping genes between the 4 datasets of whole-lung tissues regarding the 350 cilia-associated genes. c Truncated violin-plots showing mean and IQR for the expression levels of FOXJ1 and NEK6 for the 4 whole lung tissue datasets. *, p < 0.05; ***, p < 0.001 non-COPD vs COPD

