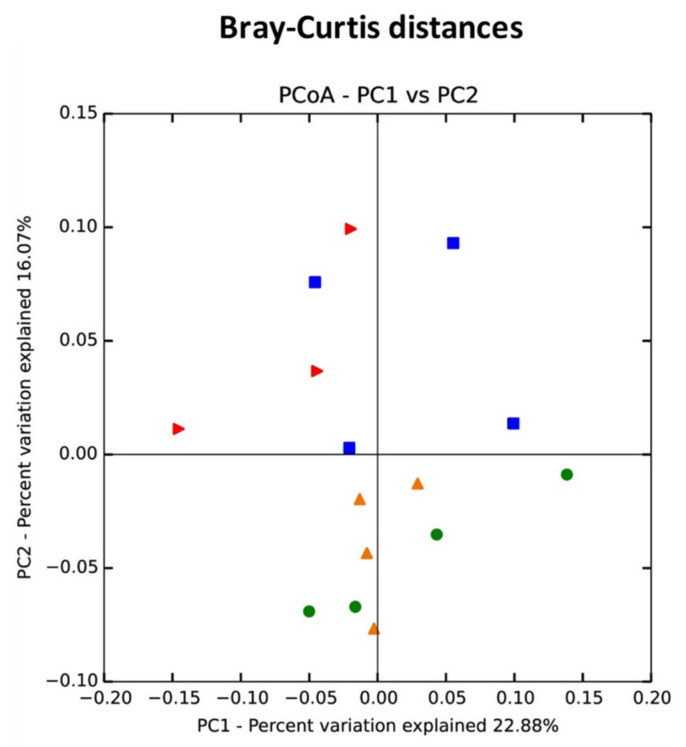
Figure 3.
Principal coordinate analysis (PCoA) analysis of fecal microbiota from control and OTA-treated mice based on Bray–Curtis distances. A distinct clustering of samples by OTA treatment was observed. The percentage of variation explained by PC1 and PC2 are noted in the axes. Groups are distinguished by colors. Each colored symbol corresponds to an individual sample.

