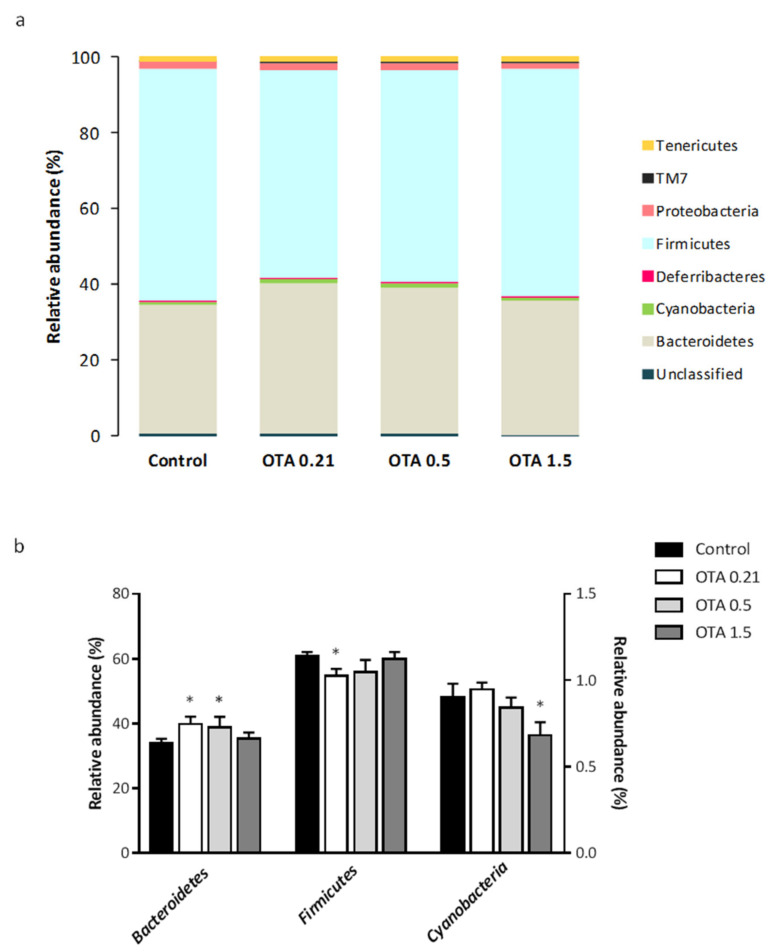
Figure 4.
Differential analysis of microbial composition at the phylum level. (a) Column plots of relative abundance of the identified phyla. Different colors represent different phyla; the percentage on the vertical axis indicates the relative abundance of each bacterial phyla. (b) Fecal microbial abundances with significant differences between control and OTA-treated groups at the phylum level. Data from Cyanobacteria refers to the right y-axis. Data are shown as mean ± standard error of the mean (SEM) (n = 3–4). Differences were assessed by non-parametric Kruskal–Wallis test followed by Mann–Whitney U test; * p <0.05 compared to control mice.

