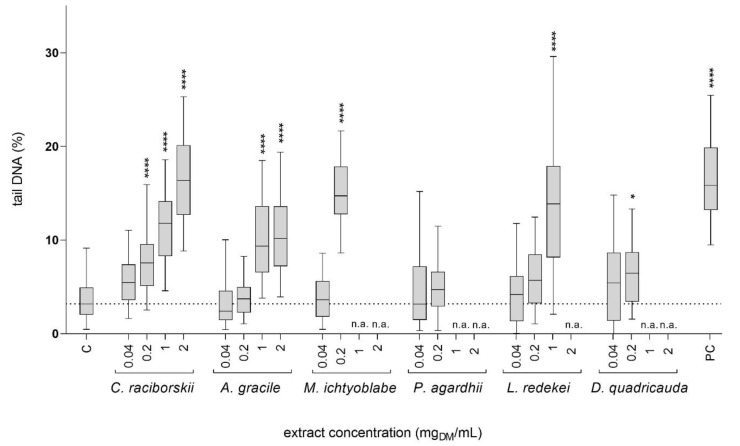
Figure 2.
The induction of DNA strand breaks in HepG2 cells after 24 h exposure to graded concentrations (0.04, 0.2, 1, and 2 mgDM/mL) of cyanobacterial and algal extracts. Benzo[a]pyrene (PC; 50 µM) was used as a positive control. Fifty cells were analyzed per experimental point in each of the two independent experiments. Data are represented as quantile box plots. The asterisks denote significant difference (nonparametric Kruskal–Wallis, Dunn’s posttest) from the vehicle control (C; 0.05% methanol): * p < 0.05, **** p < 0.0001. Cytotoxic concentrations of the extracts were not analyzed (n.a). The dotted line denotes the median value of the % tail DNA in vehicle control group.

