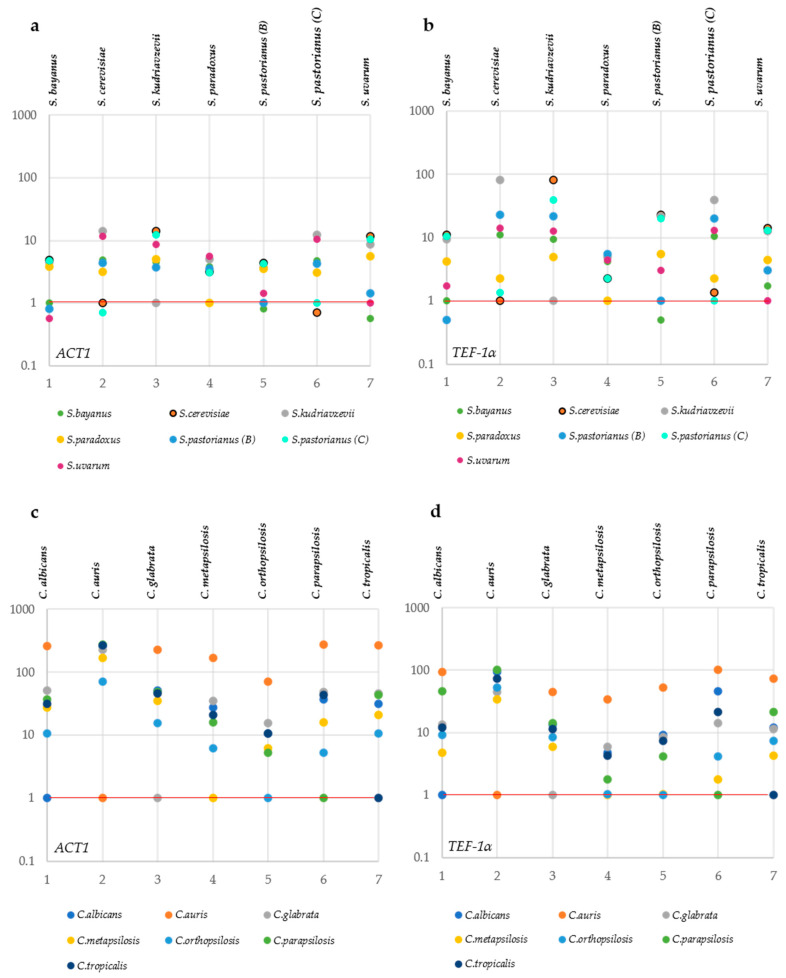
Figure 5.
MeTRe among and within the Saccharomyces and Candida species for ACT1 and TEF1-α. Resolutions calculated for the genomic ACT1 and genomic TEF1-α of Saccharomyces are displayed in panels (a,b), respectively. Genomic ACT1 and genomic TEF1-α of Candida are reported in panels (c,d). Each column shows the resolution of the species positioned in a red line (reported above each column) from the other species under analysis. The species placed below the red line have no resolution with the species reported above each column. The values of MeTRe in log scale are reported on the y-axis, while the numbers on the x-axis correspond to the species involved in the study (and depicted at the beginning of each subpanel).

