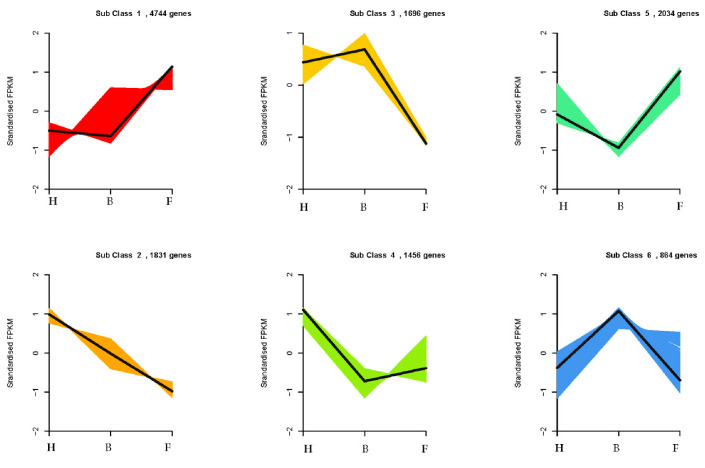
Figure 7.
K-means clustering of differentially expressed genes based on standardized (log10 transformed) fragments per kilobase of transcript per million fragments mapped values of three samples of D. nestor flowers (F, H, and B). The numbers of genes clustered in each subclass are given above each Figure. Where F = flower bud stage; H = half blooming stage; and B = full blooming stage.

