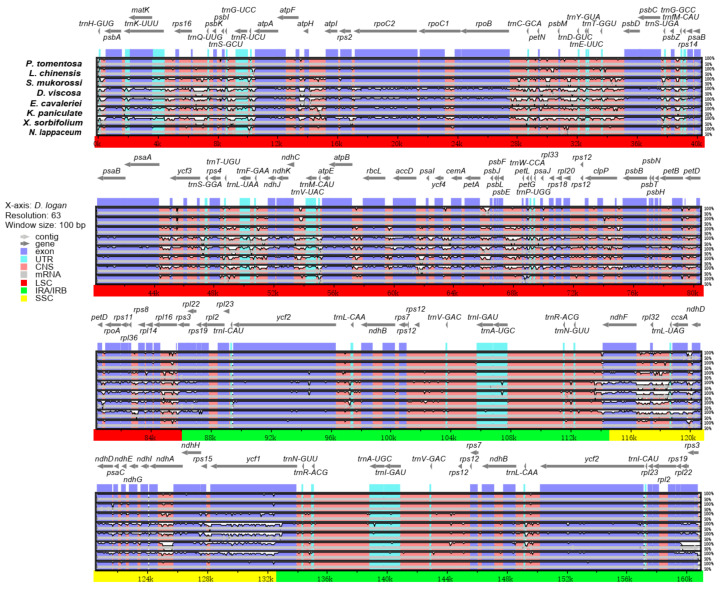
Figure 4.
Comparison of nine Sapindaceae chloroplast genomes (including D. longan, L. chinensis, P. tomentosa, S. mukorossi, D. viscosa, E. cavaleriei, K. paniculata, X. sorbifolium and N. lappaceum), with D. longan as a reference. Gray arrows and thick black lines above the alignment indicate the direction of the gene. Purple bars represent exons, blue bars represent untranslated regions (UTRs), pink bars represent conserved non-coding sequences (CNS), and gray bars represent mRNA. The y-axis indicates the identity, expressed as a percentage, between 50% and 100%.

