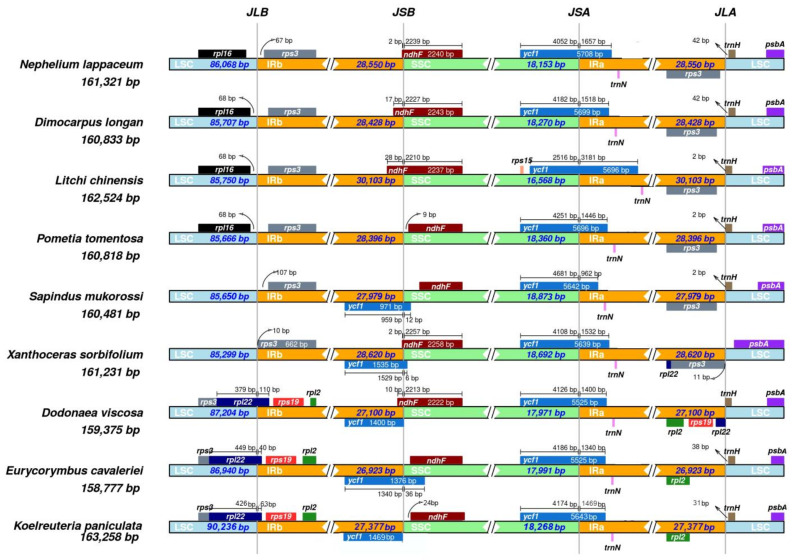
Figure 5.
Comparison of the borders of the LSC, SSC and IR regions among nine Sapindaceae chloroplast genomes. For each species, genes transcribed in positive strand are depicted on the top of their corresponding track from right to left direction, while the genes on the negative strand are depicted below from left to right. The numbers at arrows refer to the distance of the start or end position of a given gene from the corresponding junction site. The T bars above or below the genes indicate the extent of their parts with their corresponding values in the base pair. The plotted genes and distances in the vicinity of the junction sites are the scaled projection of the genome. JLB (IRb /LSC), JSB (IRb/SSC), JSA (SSC/IRa) and JLA (IRa/LSC) denote the junction sites between each corresponding two regions of the genome.

