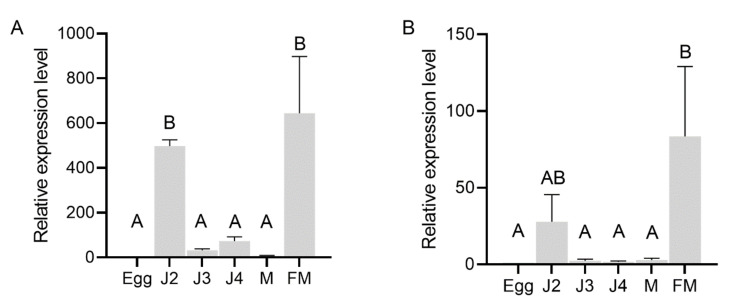
Figure 5.
Relative expression level of AbGH16s in different developmental stages of A. besseyi. (A) AbGH16-1; (B) AbGH16-2. The bars indicate the standard deviation of mean (n = 3) and different letters on the bar indicate significant differences (p < 0.01) between nematode specimens by Tukey’s test. M = male and FM = female.

