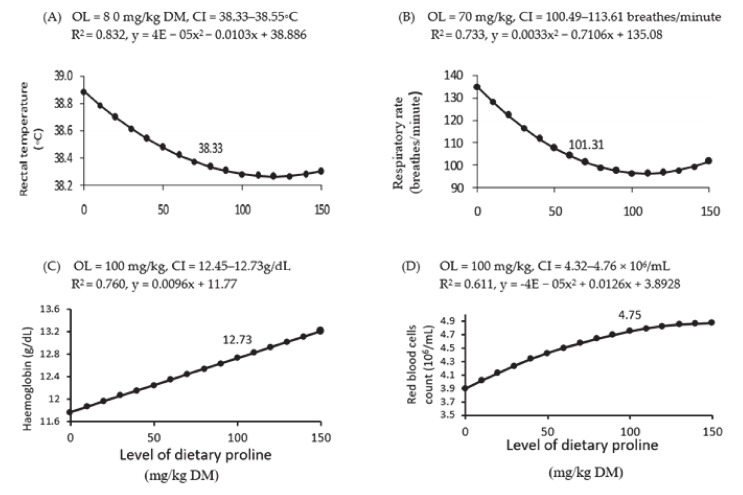
Figure 2.
Dose–response curve of rectal temperature (A), respiratory rate (B), haemoglobin concentration (C), and red blood cell counts (D) for different levels of dietary supplemental proline. DM = dry matter, OL = optimum level of dietary supplemental proline and CI = confidence interval. R2 = regression value, and x and y are the dependent variable (proline level) and the independent variable of the regression equation, respectively. The figure only shows significant (p < 0.05) relationships.

