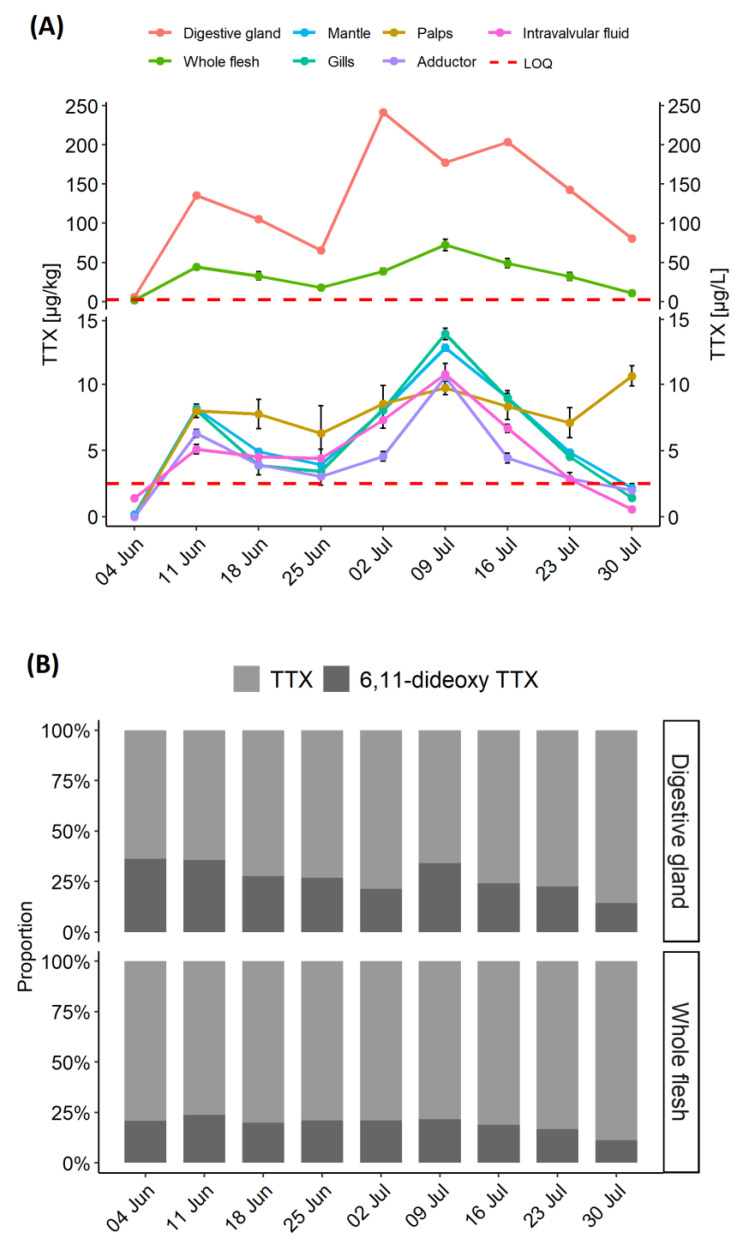
Figure 1.
Time series of TTX showing (A) TTX concentration in various C. gigas matrices; (B) relative proportions of 6,11-dideoxy TTX and TTX in the C. gigas digestive gland and the whole flesh. The samples were collected between 4 June and 30 July 2019, TTX concentrations were expressed either in µg/kg (tissues) or µg/L (right-y-axis, intravalvular fluid only). Red dashed line represents an average Limit of Quantitation for various matrices (LOQ; 2.5 µg/kg).

