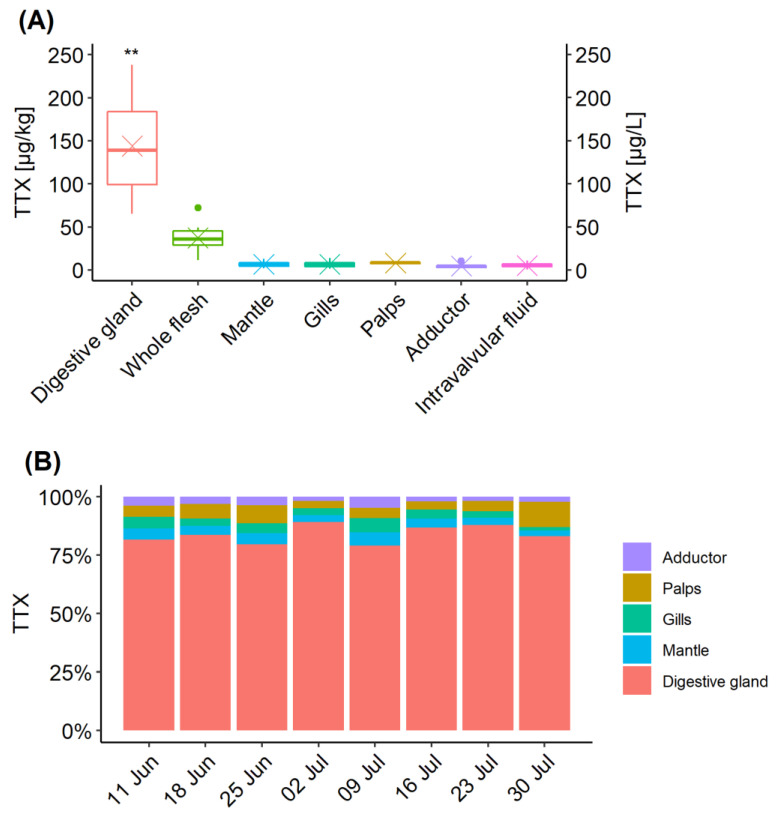
Figure 3.
TTX distribution in C. gigas tissues collected between 11 June and 30 July 2019. (A) Box and whisker plot showing TTX concentration means (cross), median (horizontal line), 1 and 3 quartiles and outliers (dots) in each C. gigas tissue. ** means significance p < 0.01 when compared to other organs and p < 0.05 when compared to “Whole flesh”; (B) Relative proportions of TTX concentrations in individual C. gigas tissues over time.

