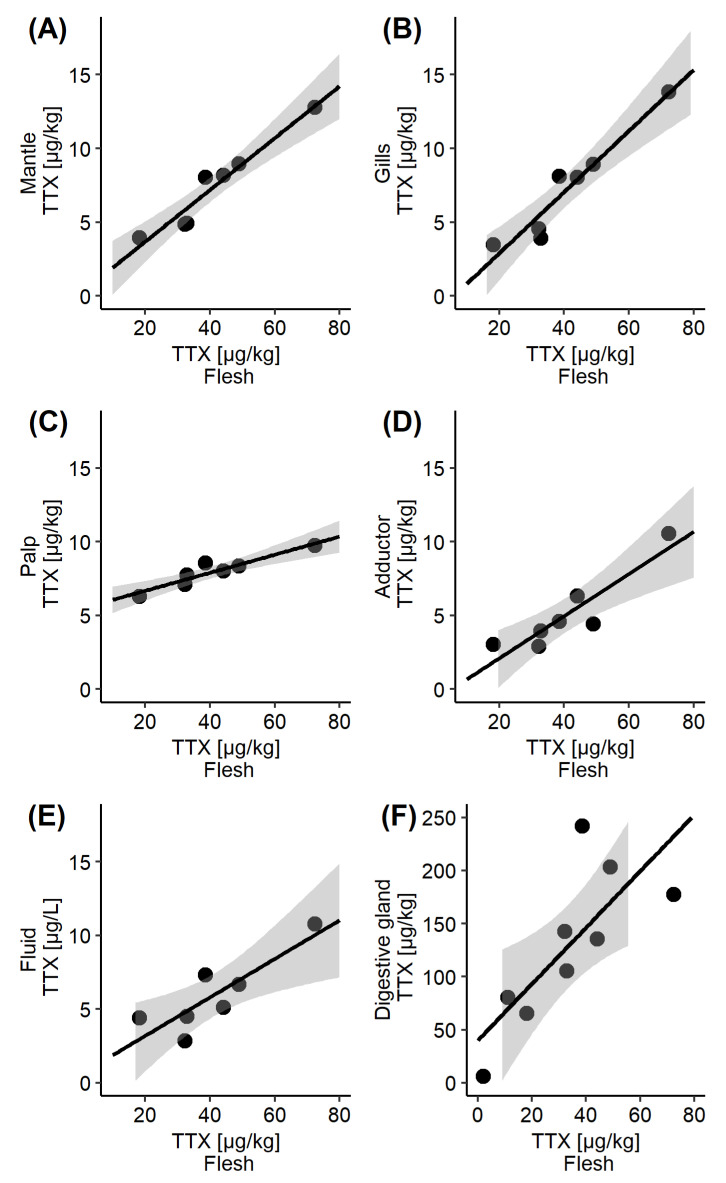
Figure 4.
Scatter plot of the mean TTX concentrations in the whole flesh, collected between 11 June and 23 July 2019, and the corresponding mean TTX concentrations in various C. gigas matrices: (A) Mantle; (B) Gills; (C) Palps; (D) Adductor; (E) Intravalvular fluid; (F) Digestive gland, which also included datapoints from 4 June and 30 July. The fitted line represents linear regression, together with the 95% confidence interval.

