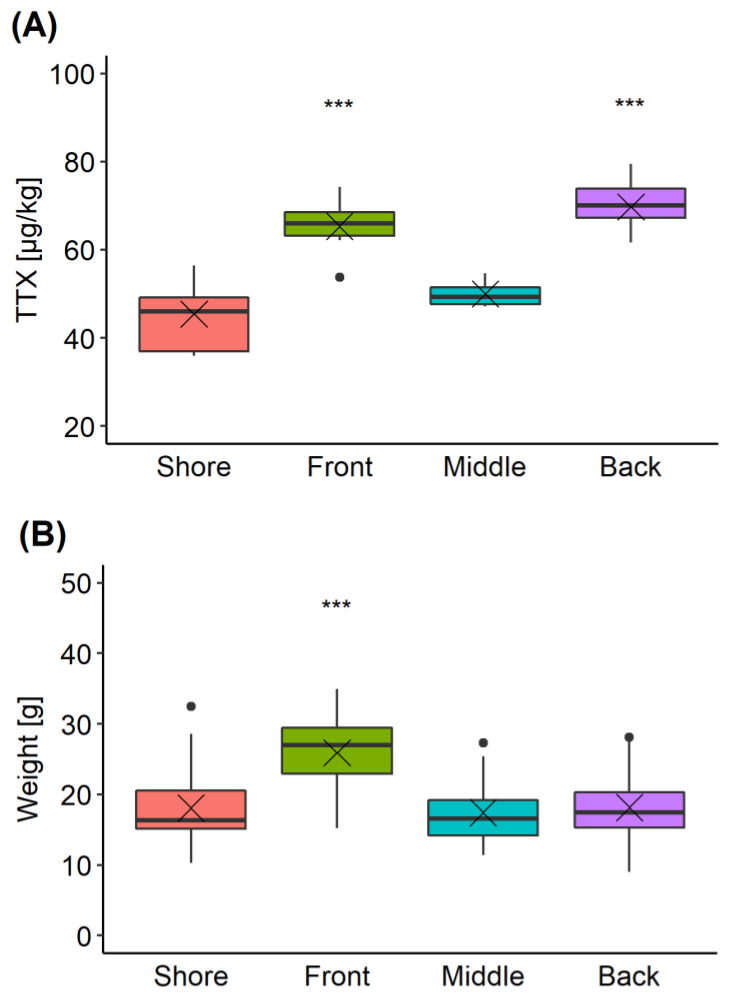
Figure 7.
Box and whisker plot showing means (cross), median (horizontal line), 1st and 3rd quartiles, outliers (dots) for TTX (A) and weight of animals (B) in each of four locations (“Shore”, “Front”, “Middle” and “Back”) within the oyster production area. *** means significance p < 0.001 (pairwise t-test) when compared to “Shore” and “Middle” (A), or when compared to other locations (B).

