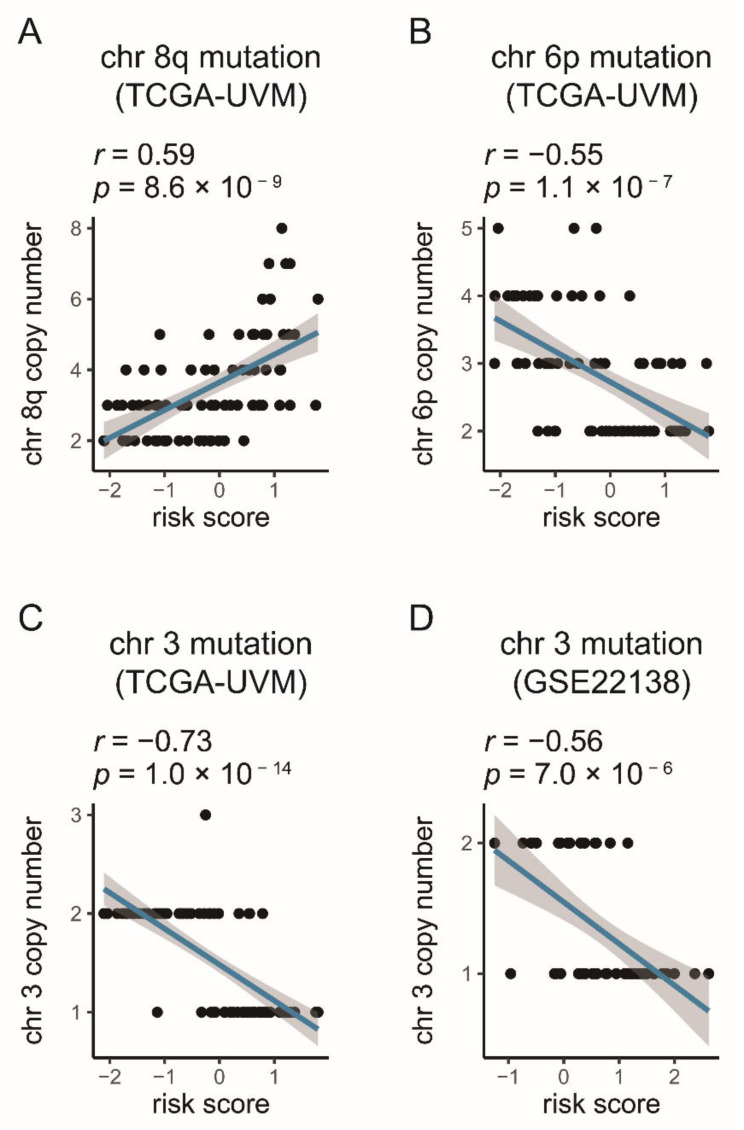
Figure 6.
Correlations between the gene signature and the chromosome aberrations in UM (A–D). The blue line in each graph fits a linear model that indicates the proportional trend of copy number and the risk score. The grey shading around the blue line indicates the 95% confidence interval. The correlation examination was conducted by the Pearson coefficient.

