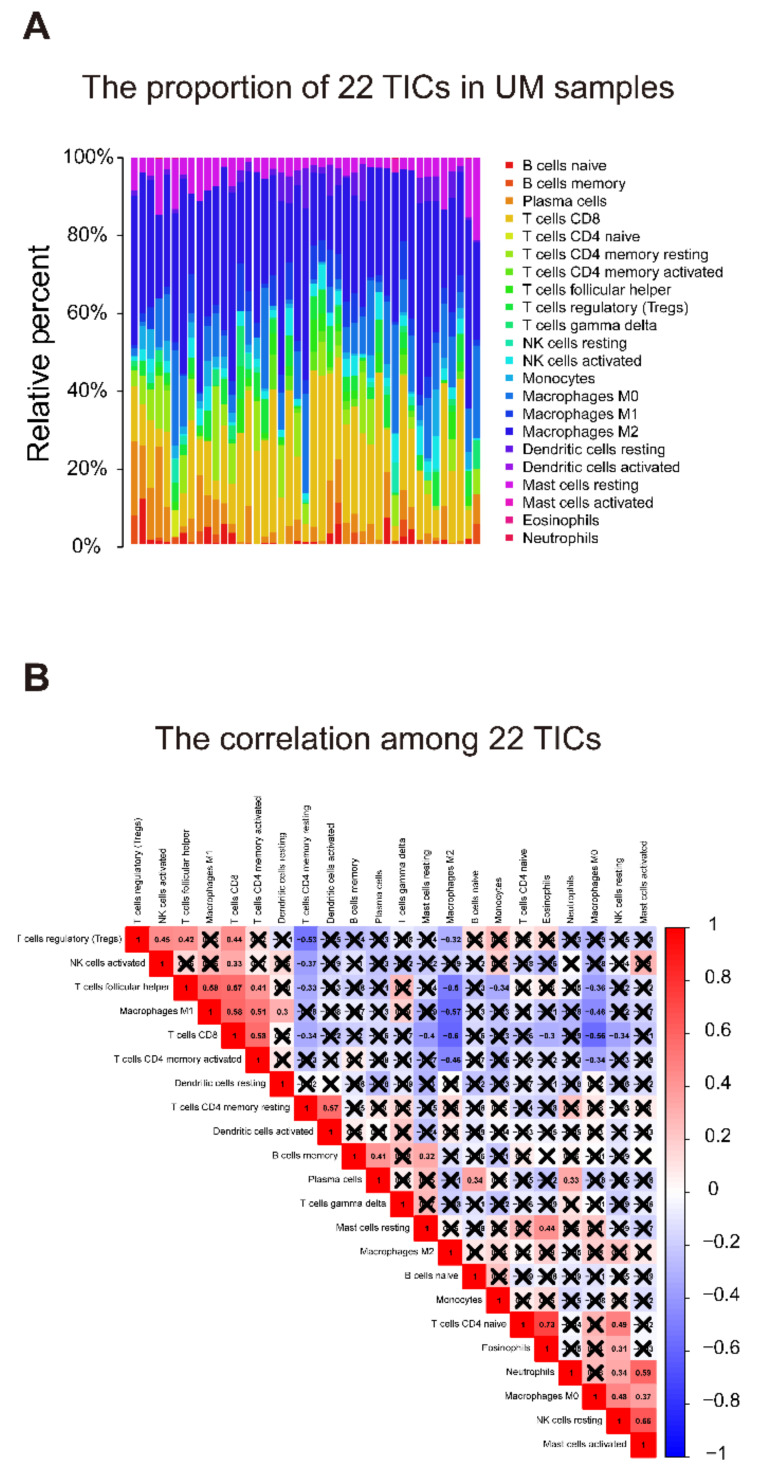
Figure 9.
TIC distribution map and correlation analysis of UMs in the training cohort. (A) The bar graph shows the relative content distribution of 22 TICs of UMs in the training cohort. Columns represent UM cases. (B) The heatmap shows the correlation between 22 TICs. The color and number in each box indicate the coefficient between the two TICs. The coefficient of X-shaped coverage is not significant. Correlation test is conducted by the Pearson coefficient. p-value < 0.05 is the significance threshold. UM: uveal melanoma; TIC: tumor-infiltrating immune cell.

