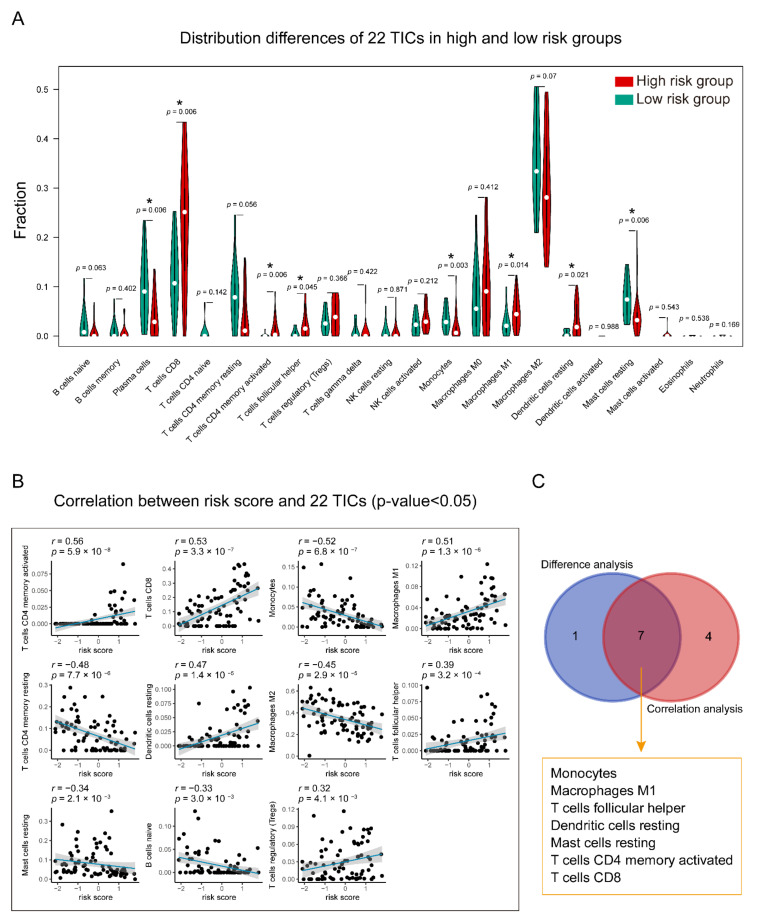
Figure 10.
Relationship between TICs and seven-gene signature risk score. (A) The Violin plot shows the ratio differentiation of each of 22 TICs between high- and low-risk groups. Wilcoxon rank-sum was applied for the significance test. (B) The correlations between the TICs and seven-gene signature risk score (only correlations with significate were plotted). The blue line in each graph fits a linear model that indicates the proportional trend of the TICs and the risk score. The grey shading around the blue line indicates the 95% confidence interval. Correlation test is conducted by the Spearman coefficient. (C) The Venn diagram exhibits that the seven TICs have a strong correlation with the risk score. This strong correlation is co-determined by the results of the violin and scatters plots. p-value < 0.05 is the significance threshold. UM: uveal melanoma; TIC: tumor-infiltrating immune cell; * p-value < 0.05.

