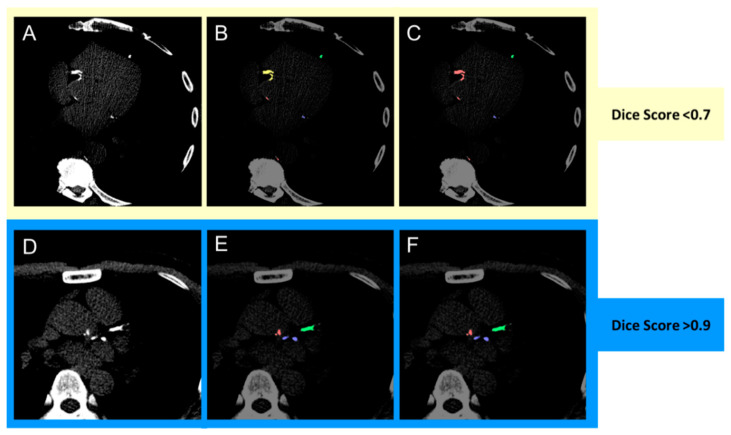
Figure 3.
Dice score visualization. (A,D) Original image; (B,E) ground truth annotation; (C,F) deep learning model output. The Dice score is commonly used to gauge the model performance and ranges from 0 to 1, with 1 corresponding to a pixel perfect pixel match between the ground truth annotation. In the images above, the prediction with the lower Dice score (C) is due to the model misclassifying right coronary artery calcification (yellow) as aortic calcium (red). The prediction with the higher Dice score (F) correctly classifies left anterior descending (green), left circumflex (blue) and aortic calcification (red) correctly.

