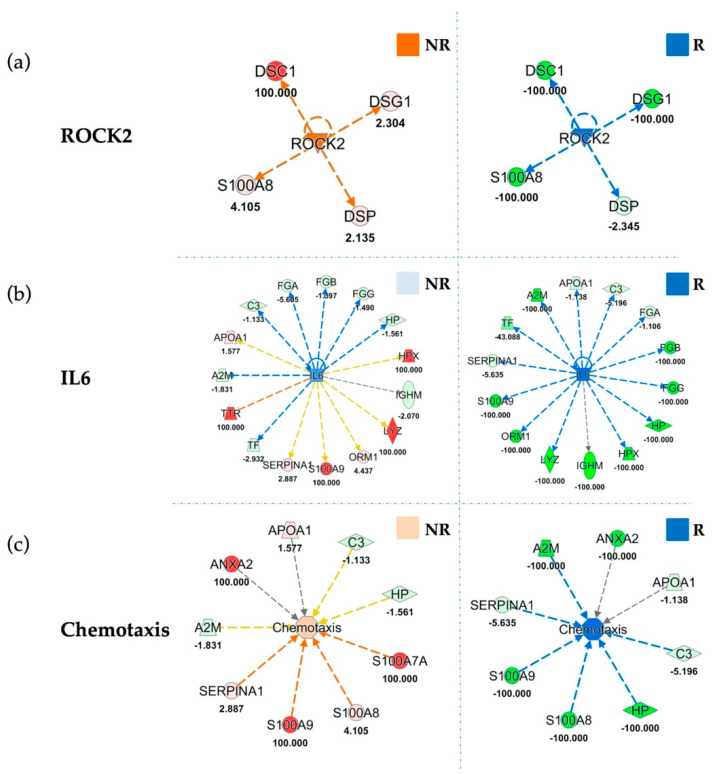
Figure 5.
Functional Comparison Analysis between activated and inhibited pathways in sorted EVs from not responding (NR) and responding (R) patients, as compared to their respective baselines. Panel (a) highlights ROCK2 in NR and R sorted EVs compared to their baselines. Panel (b) shows IL6 modulation in NR and R EVs. Panel (c) reports the same comparison for “Chemotaxis” function. Overall ROCK2, IL6 and Chemotaxis are inhibited (blue) in responders, as compared to baseline, whereas in non-responders they result activated (orange) or unchanged (light blue). Red and green shapes represent increased or decreased measurements of identified proteins, respectively, whose fold change value is reported in the figure. Color key and symbols are reported in Supplementary Figure S8.

