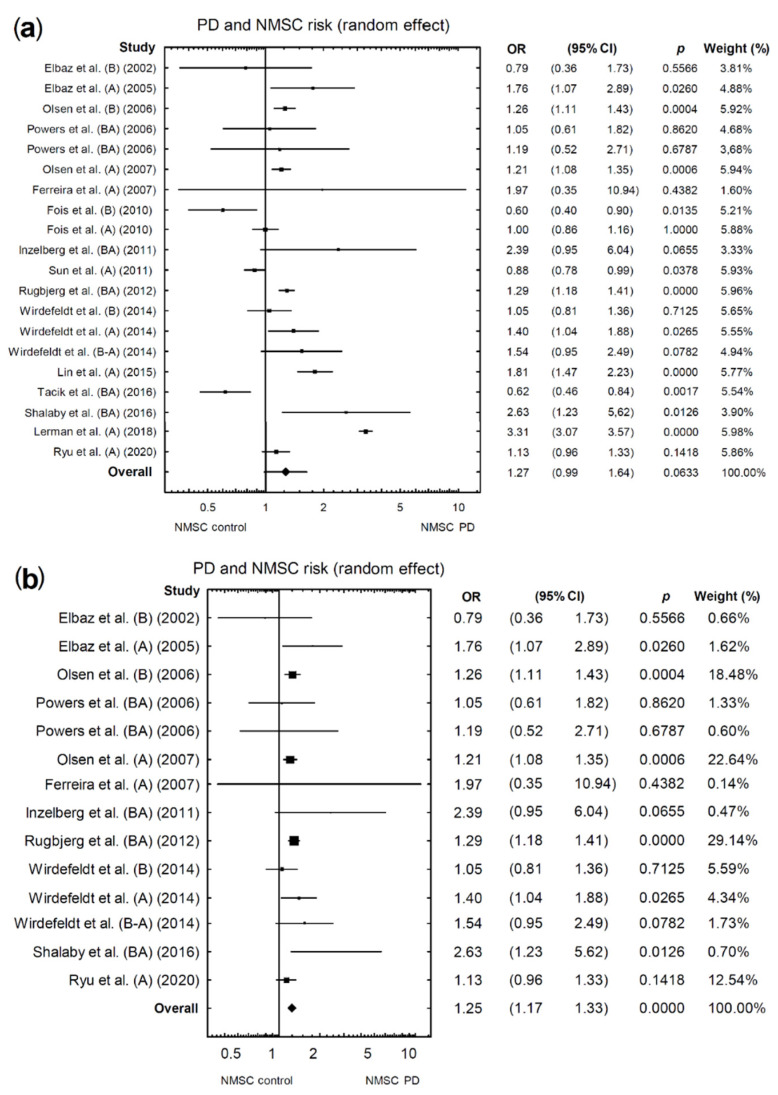
Figure 2.
Forest plot of pooled studies of NMSC occurrence in PD patients: (a) all studies; (b) studies causing high heterogeneity excluded. Each line represents an individual study result, with the width of the horizontal line indicating a 95% confidence interval (CI) and the position of the box representing the point estimate OR (odds ratio) (B—NMSCs before PD diagnosis, A—NMSCs after PD diagnosis, BA—NMSCs diagnosed before or after PD diagnosis, B-A NMSCs diagnosed ±1 year before or after PD diagnosis).

