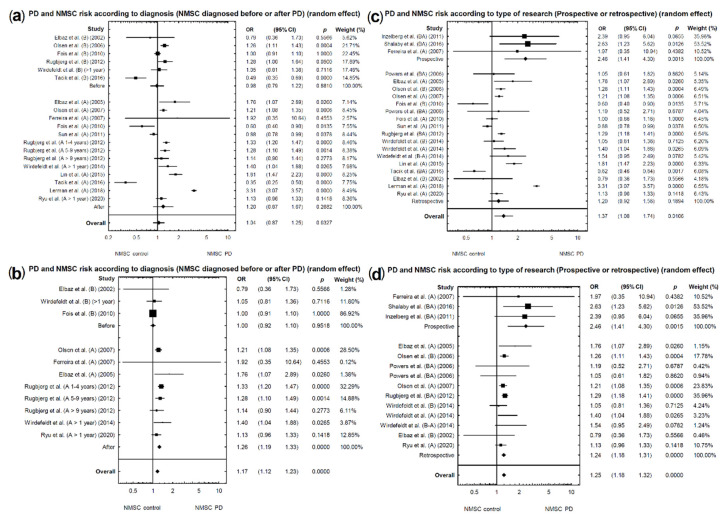
Figure 5.
(a,b) Forest plot of pooled studies of NMSCs diagnosed before or after incidence of PD in patients: (a) all studies; (b) studies causing high heterogeneity excluded. (c,d) Forest plot of pooled studies of NMSC incidence in PD patients according to the type of study (prospective or retrospective): (c) all studies; (d) studies causing high heterogeneity excluded. Each line represents an individual study result, with the width of the horizontal line indicating a 95% confidence interval (CI) and the position of the box representing the point estimate OR (odds ratio) (B—NMSCs before PD diagnosis, B-A NMSCs diagnosed ± 1 year before or after PD diagnosis.

