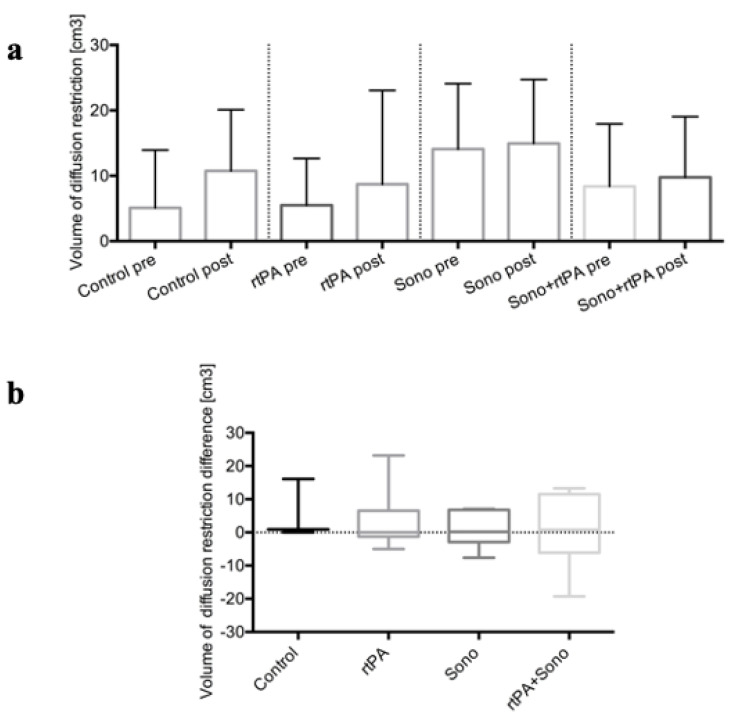
Figure 3.
Cranial MRI (control group n = 3; treatment groups (2–4); each n = 6); (a) Volumes of diffusion restriction [cm3] (y-axis) of the different groups (1–4) (x-axis) before and after treatment are illustrated as a column bar graph plotting mean and SD. (b) Volumes of diffusion restriction difference [cm3] (y-axis) of the different groups (1–4) (x-axis) after treatment are depicted as box plots.

