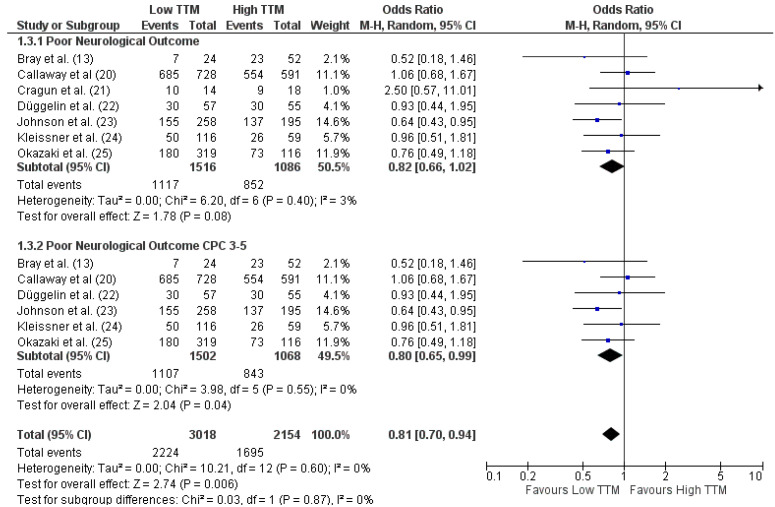
Figure 2.
Forest plot for unfavorable neurological outcome in all patients with reported outcome and in all those with reported CPC 3–5. Low TTM = TTM at 33 °C; High TTM = TTM at 36 °C. The size of the squares for the risk ratio reflects the weight of the trial in the pooled analysis. The horizontal bars represent 95% confidence intervals (CIs) [13,20,21,22,23,24,25].

