Fig. 4.
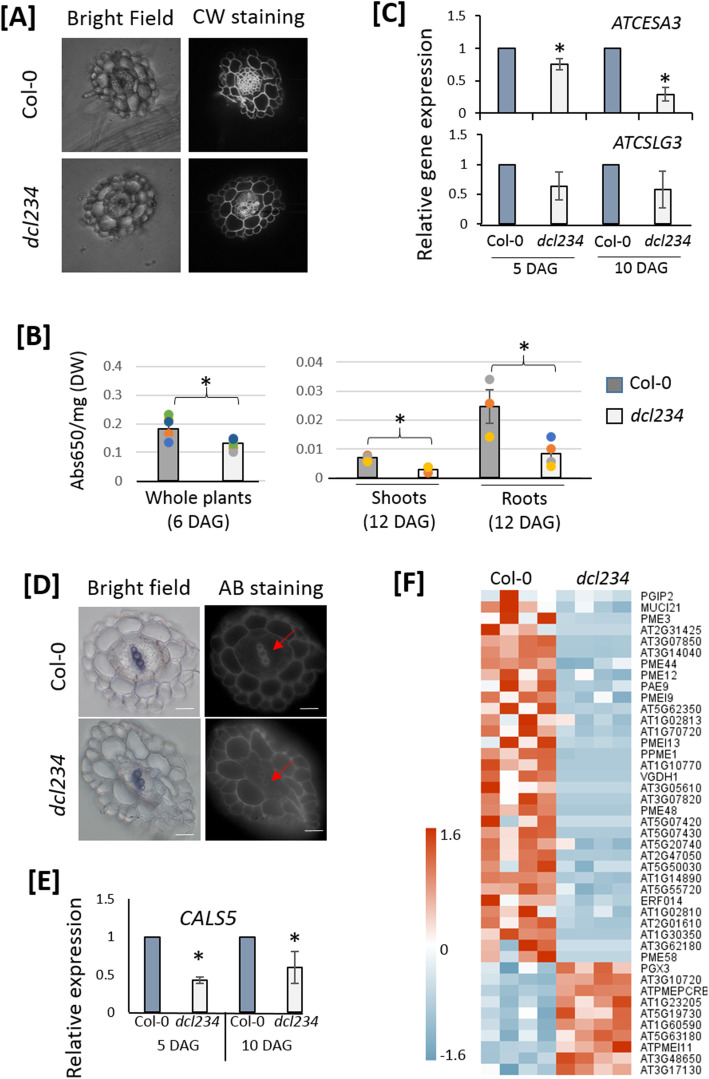
The dcl234 mutant shows decreased deposition of cellulose and callose in root xylem. a Visualization of cellulose deposition by Calcofluor White (CW) staining. Transverse sections of primary roots from 12-day-old plants were compared. Representative images of 10 replicates are shown. b Quantification of cellulose contents in 6-day-old (n = 80 seedlings per biological replicate) whole seedlings and 12-day-old (n = 40 seedlings per biological replicate) shoots and roots. Mean ± SE, n = 3 biological replicates. * indicates p ≤ 0.05, student t test. c Quantitative RT-PCR measurements of Arabidopsis CSLG3 and CESA3 gene expression levels. Mean ± SE, n = 3 technical replicates. Two biological replicates were analyzed with similar results. * indicates p ≤ 0.05, student t test. d Visualization of callose deposition by Aniline blue (AB) staining. Red arrows point to the xylems where the callose levels are different in dcl234 and Col-0. Transverse sections of primary roots from 12-day-old plants were compared. Representative images of 3 replicates are shown. e Quantitative RT-PCR measurements of Arabidopsis CALS5 gene expression levels. Mean ± SE, n = 3 technical replicates. Two biological replicates were analyzed with similar results. * indicates p ≤ 0.05, student t test. f A heatmap of DEGs related to pectin homeostasis, as identified in RNAseq analysis. See also Figure S8

