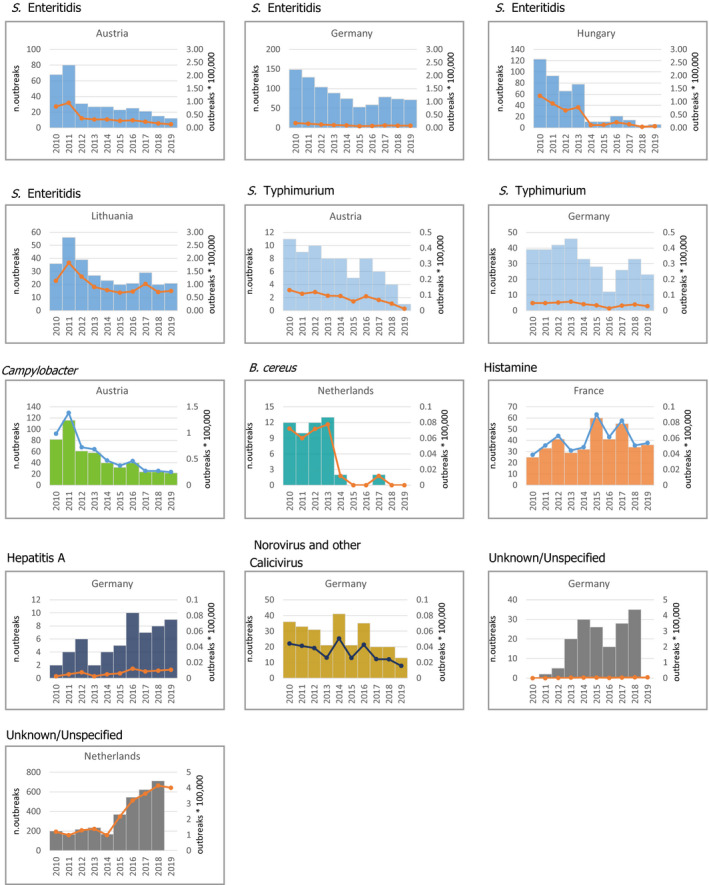
Figure 70.

Trends in number of outbreaks (left axis) and outbreak reporting rate (per 100,000 population) (right axis) by causative agent, in reporting EU MS, 2010–2019. Only MS and causative agents with a statistically significant temporal trend are shown
- Note: only causative agents and countries with statistically significant trends and more than five outbreaks reported per year, on average, are visualised. ‘B. cereus’ includes FBOs with causative agent encoded as B. cereus enterotoxins. ‘Hepatitis A’ includes also FBOs with causative agent encoded as ‘hepatitis virus, unspecified’.
