Figure 3.
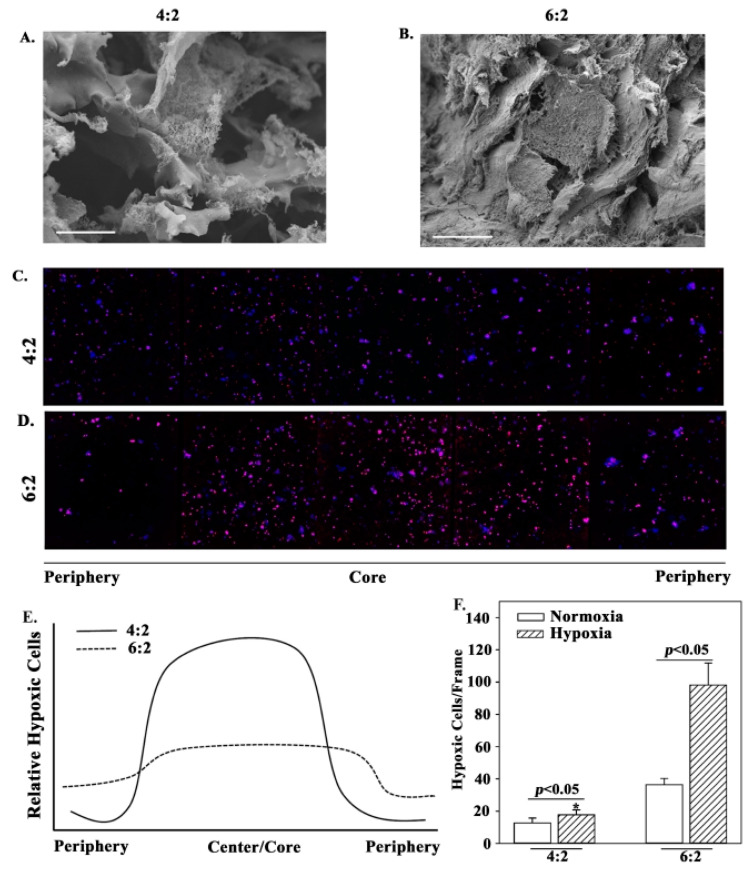
Scaffold ultrastructure and cell hypoxia. The ultrastructure of (A) 4:2 and (B) 6:2 cell-free scaffolds, by scanning electron microscopy (SEM). Shown are representative images at 2500X magnification. Scale bar: 10 µm. (C) Cells in 4:2 (C) and 6:2 (D) scaffolds were visualized by confocal microscopy for hypoxic cells from periphery to core. The number of hypoxic cells (expressing the Lox1 fluorescent hypoxia probe) in normoxic (open bar) or hypoxic (diagonal-stripped bar) incubation systems. Cells within (C) 4:2 and (D) 6:2 scaffolds treated with a Lox1 fluorescent hypoxia probe were imaged using confocal microscopy at 10X magnification. The relative differences between ‘C’ and ‘D’ along the structures are diagrammatically presented in (E). The number of normoxic and hypoxic cells were counted across 5 frames and the values presented as mean cells±SD (F), * p < 0.05 vs. 6:2 hypoxic cells. The images represent three different independent experiments.

