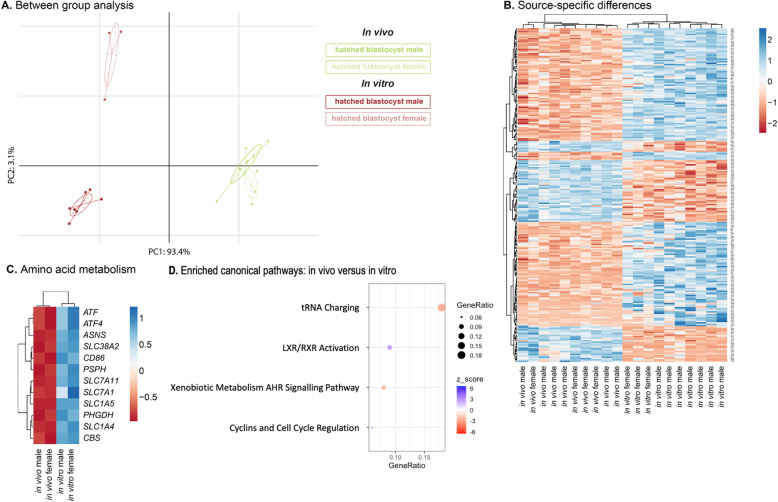
Fig. 6.
a. Between group analysis of in vivo and in vitro female and male hatched blastocysts. b. Heatmap displaying the 243 DEGs observed by comparing in vivo produced versus in vitro developed females and the in vivo produced versus in vitro developed males. c. Heatmap displaying genes involved in amino acid metabolism, and d. Significantly enriched canonical pathways between the in vivo developed and in vitro produced hatched blastocysts. Red (−) dots represent canonical pathways of which genes were significantly less expressed in the in vivo embryos, while blue (+) represent canonical pathways of which genes were significantly higher expressed in the in vivo embryos. The GeneRatio indicates the proportion of DEGs that were identified in an enriched canonical pathway

